Image Processing Reference
In-Depth Information
3.3
Brain Growth Model
We estimated the longitudinal velocities,
g
(
t
k
,t
k
+1
), from the subject- and age-
dependent average velocity fields which were also used to compute the time
series of mean template images of the atlas. These stationary velocity fields were
interpolated in both space and time by a cubic B-spline in order to obtain a
continuous spatio-temporal growth model. We then used this deformation model
to transform the mean tissue probability maps of the atlas at 44 weeks GA
backward in time using the computed longitudinal point trajectories. As the
longitudinal growth model is diffeomorphic, the probability maps from 28 weeks
GA (or any other time point) could also be propagated forward (and backward)
in time, which would result in very similar deformed tissue maps because the
point trajectories given by (
16
) only differ by a small error resulting from the
numerical integration. The decision to propagate the probability maps backwards
in time has the advantage of a lower interpolation error close to anatomical
boundaries due to the higher detail and bigger scale of the anatomy at later time
points. From the propagated probability maps, we extracted the total volume
of brain tissue and the cortical grey matter volume at one week intervals. The
measured volumes, plotted against age at scan in Fig.
4
, exhibit a Gompertz
like growth pattern with a high
R
2
value of 0.996 in both cases. This finding
is in agreement with the results in [
21
], where cortical folding of fetuses was
measured instead of cortical grey matter volume of preterm born neonates. While
a cubic polynomial yielded a similar good fit for our measured brain volumes, we
chose the Gompertz function because it has better extrapolation properties and
was demonstrated to model the evolution of cortical folding during early brain
development better than linear or quadratic polynomial functions [
21
].
400
200
350
300
150
250
200
100
150
100
50
Measured volumes
Fit Gompertz function
99% confidence intervals
Measured volumes
Fit Gompertz function
99% confidence intervals
50
28
30
32
34
36
38
40
42
44
28
30
32
34
36
38
40
42
44
Gestational age at scan [weeks]
Gestational age at scan [weeks]
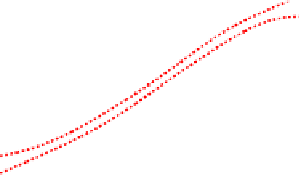
Fig. 4.
Mean volumes of brain tissue and cortical grey matter plotted against age
at time of scan. The volumes were extracted from the mean tissue probability maps
at age 44 weeks GA, after propagating these backward in time using our continuous
longitudinal growth model. A Gompertz function (solid line) was fitted to the data
points and 99% confidence intervals (dashed lines) are shown.


Search WWH ::

Custom Search