Image Processing Reference
In-Depth Information
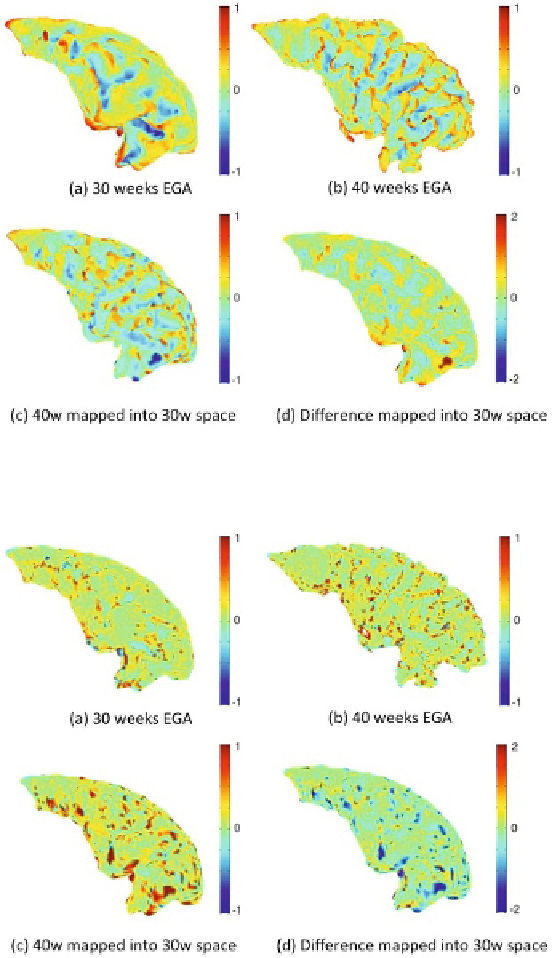
at 31 weeks and 42 weeks EGA. The maps of mean and Gaussian curvature change
in 30 week space (Figure
4
(d) and Figure
5
(d)) show the locations where the
secondary and tertiary sulci and gyri will be formed, as well as how the primary
sulci and gyri will develop. These changes are commensurate with [
5
].
Fig. 4.
Maps of mean curvature changes for one subject scanned at 31 and 42 weeks
EGA
Fig. 5.
Maps of Gaussian curvature changes for one subject scanned at 31 and 42 weeks
EGA
Search WWH ::

Custom Search