Agriculture Reference
In-Depth Information
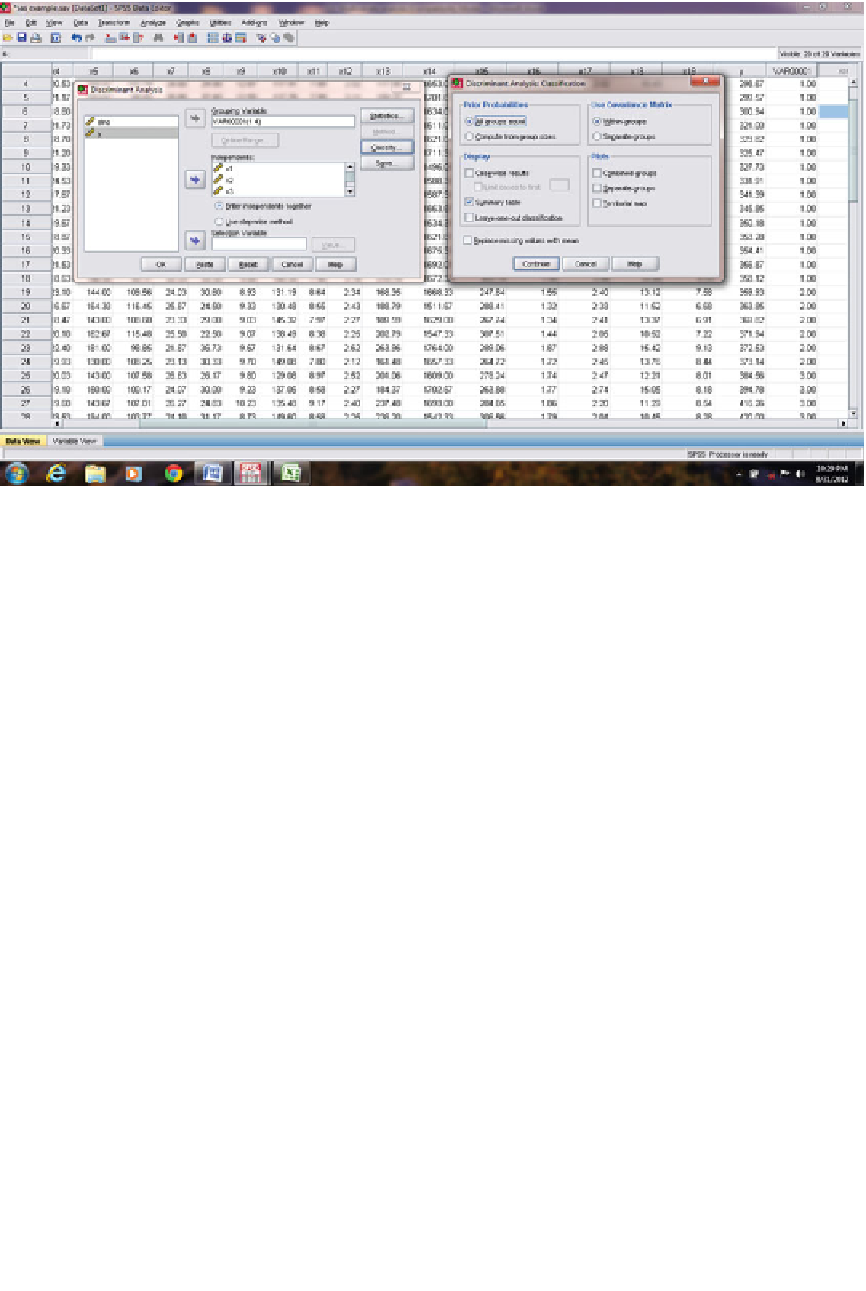
Slide 12.30: Data structure, selection of appropriate variables, and classification option in discriminant analysis using
SPSS (Table
12.7
)
Table 12.7
Discriminant analysis output using SPSS
Analysis Case Processing Summary
Unweighted Cases
N Percent
Valid
37
100.0
Excluded Missing or out-of-range group codes
0
.0
At least one missing discriminating variable
0
.0
Both missing or out-of-range group codes and at least one missing discriminating variable
0
.0
Total
0
.0
Total
37
100.0
By using same data with SPSS, one gets the
following output:
Group statistics
Valid N (listwise)
VAR00001
Mean
Std. deviation
Unweighted
Weighted
1
x1
32.8822
2.46721
18
18.000
x2
1.4874E2
9.29225
18
18.000
x3
1.3246E2
8.86043
18
18.000
x4
20.4217
1.70423
18
18.000
x5
1.6609E2
15.40695
18
18.000
x6
1.0137E2
6.84825
18
18.000
x7
22.3661
2.19903
18
18.000
x8
32.5050
4.36185
18
18.000
x9
9.8800
1.32207
18
18.000
x10
1.3515E2
8.81418
18
18.000
x11
7.5578
.51970
18
18.000
x12
2.0706
.12982
18
18.000