Agriculture Reference
In-Depth Information
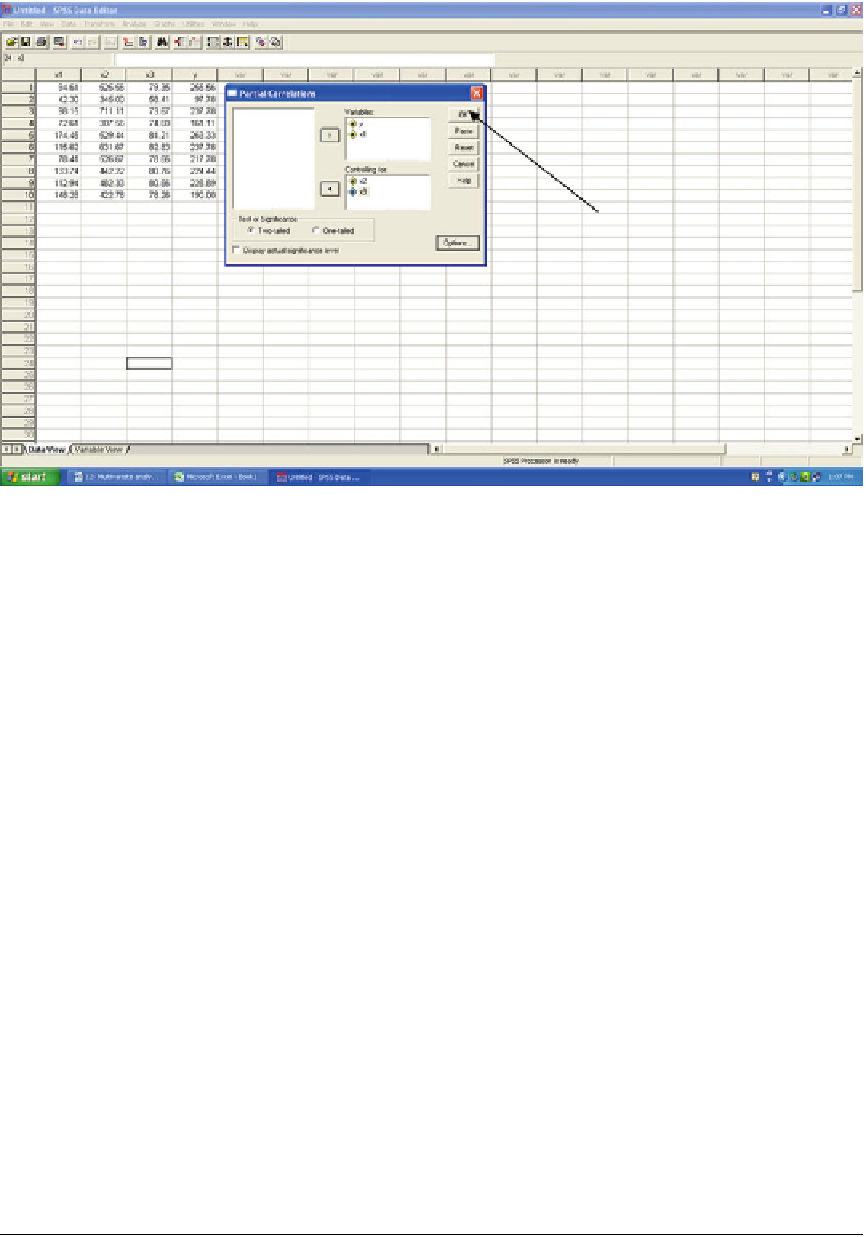
Slide 12.12: Data structure and selection of appropriate variables in correlation submenu in analysis menu of SPSS
Step 3: Click OK to get the following output.
In the similar fashion, by changing the variables
in Step 2, one can have different combinations
of partial correlation coefficients among the
variables. Given below are the different partial
correlation coefficients of dependent variable
Y
with other variables as worked out following the
above process (Table
12.5
).
Table 12.5
Output table of partial correlation analysis using SPSS
To get the following partial correlation coefficients:
---PARTIAL CORRELATION COEFFICIENTS---
Controlling for: X2
X3
Y
X1
Y
1.0000
.2488
X1
.2488
1.0000
---PARTIAL CORRELATION COEFFICIENTS---
Controlling for.. X3
X1
Y
X2
Y
1.0000
.7890*
X2
.7890*
1.0000
---PARTIAL CORRELATION COEFFICIENTS---
Controlling for: X1 X2
Y X3
Y 1.0000 .7778*
X3 .7778* 1.0000
* - Signif. LE .05 ** - Signif. LE .01 (2-tailed)
" . " is printed if a coefficient cannot be computed