Agriculture Reference
In-Depth Information
but packages like SPSS and SAS provide partial
correlation coefficient.
Let us take the Example 12.1 of this chapter to
demonstrate the process of getting partial corre-
lation coefficient using SPSS.
The following table gives the information on
ten varieties of mulberry. Find out the partial
correlation coefficients of leaf yield on other
three yield attributing characters.
Leaf area (cm
2
):
X
94.61
42.3
98.15
72.61 174.45 115.62
78.41 133.74 112.94 148.28
1
Total shoot length(cm):
X
2
525.56 345
711.11 307.56 529.44 631.67 526.67 442.22 482.33 422.78
Leaf moisture(%):
X
79.35
58.41
73.67
74.6
81.21
82.83
78.66
80.76
80.66
78.26
3
Leaf yield/plant(g):
Y
255.56
97.78 237.78 161.11 263.33 237.78 217.78 224.44 228.89 190
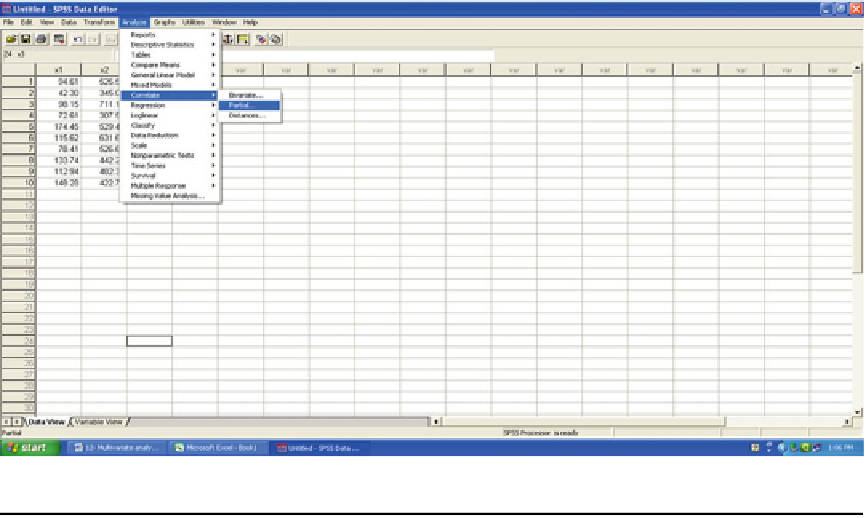
Step 1: Up on transferring the data to SPSS
editor, go to Analyze, followed by Correlate
and Partial, as shown below:
Slide 12.11: Data structure and selection of appropriate correlation submenu in analysis menu of SPSS
Step 2: Select the variables for which partial
correlation is to be worked out and also the
variables for which effects are to be eliminated,
as shown below.