Agriculture Reference
In-Depth Information
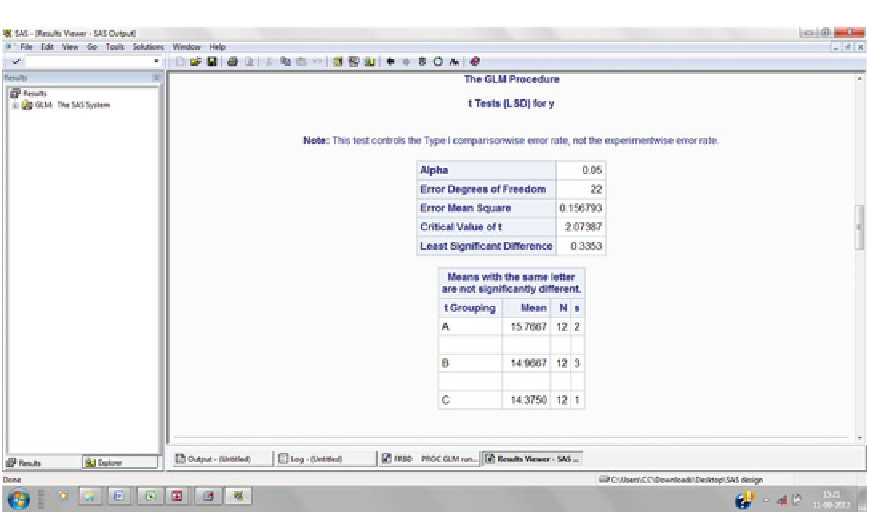
Slide 10.34: Step 3 showing portion of output for two-factor Factorial RBD analysis using SAS
10.11.2 m n p Factorial
Experiment
Let us take the following examples of 2
3
4
FRBD.
Example 10.16.
The following table gives the
yield (q/ha) from a field experiment of paddy
with three doses of phosphate fertilizer and four
doses of nitrogen in two types of irrigation in a
randomized block design. Analyze the data to
find out the best dose of phosphate, the best
dose of nitrogen, the best irrigation, and the
best interaction effects among the factors.
In an
three-factor factorial experi-
ment, three factors are tested of which the first,
second, and third factors are at
m n p
m
n
p
levels,
respectively; the efficacy of levels of different
factors separately and the interactions of the
levels of different factors are worked out. A
three-factor factorial experiment can be designed
in a CRD, RBD, or LSD fashion. But the problem
with LSD is that even at the lowest level of three-
factor factorial experiment, that is, 2
3
factorial
experiment, we require to get a plot of 8
,
, and
Solution. The experiment is an asymmetrical
(2
4) factorial experiment conducted in
randomized block design, so the appropriate
statistical model for the analysis will be
y
ijkl
¼ μ þ α
i
þ β
j
þ αð
ij
þ γ
k
þðαγÞ
ik
þ
ðβγÞ
jk
þðαβγÞ
ijk
þ δ
l
þ e
ijkl
, where
3
8
experimental area, and any factor having a level
more than two in a three-factor factorial experi-
ment requires at least a plot of 12
12 number of
experimental units. In reality most of the times, it
becomes difficult to get such a plot and impossi-
ble when the levels of any factor increase beyond
this three-level limit. Thus, three-factor and
more-than-three-factor factorial experiments are
generally conducted in CRD or RBD design.
i ¼
2;
j ¼
3;
k ¼
4;
l ¼
3
y
ijkl
¼
response in the
l
th replicate due to the
i
th
th level of phosphate,
and the
k
th level of nitrogen
μ ¼
level of irrigation, the
j
general effect