Agriculture Reference
In-Depth Information
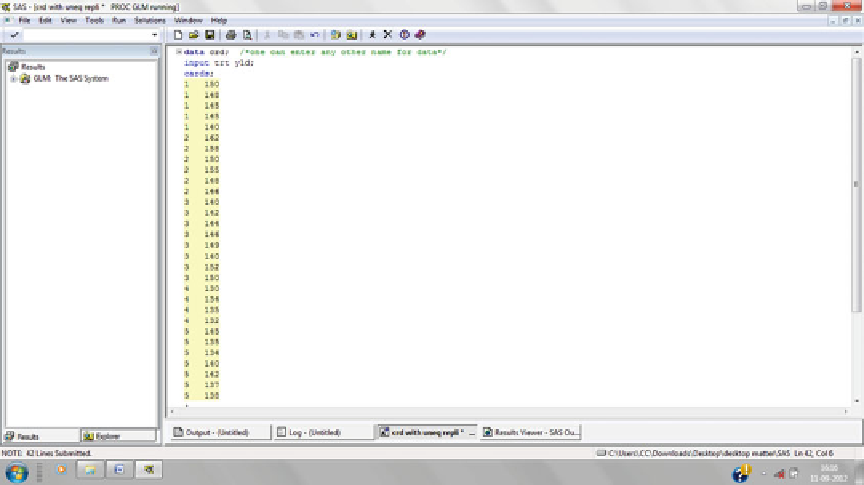
comparing the varieties, we have the following
critical difference and mean difference values
among the varieties:
ANOVA
SOV
d.f.
SS
MS
F
Variety
4
1231.780
307.945
15.212
Error
25
506.087
20.243
CD
(0.05)
values
Mean
difference
y
i
0
y
i
0
0
Total
29
1737.867
j
j
Comparison
Conclusion
F
0.05;4,25
¼
The table value of
4.18.
(Variety
A-variety B)
5.612
7.567
Varieties are
different
(tab)
0.05;4,25
, so the test is sig-
nificant and reject the null hypothesis of equality of
grain weight per hill. We conclude that there exist
significant differences among the five varieties of
wheat with respect to grain weight per hill.
So, the next objective is to find out the
varieties which differ significantly among them-
selves and the variety/varieties having signifi-
cantly the highest weight per hill.
To compare the varieties we calculate the
critical difference value, which is given as
Thus,
F
(cal)
> F
(Variety
A-variety C)
5.284
0.225
Varieties are
the same
(Variety
A-variety D)
6.217
12.85
Varieties are
different
(Variety
A-variety E)
5.427
6.886
Varieties are
different
(Variety
B-variety C)
5.006
7.792
Varieties are
different
(Variety
B-variety D)
5.983
20.417
Varieties are
different
(Variety
B-variety E)
5.156
14.452
Varieties are
different
s
(Variety
C-variety D)
5.676
12.625
Varieties are
different
1
r
i
þ
1
r
i
0
MSE
t
0
:
025
;
err
:
d
:
f
:
(Variety
C-variety E)
4.797
6.661
Varieties are
different
s
1
r
i
þ
1
r
i
0
¼
20
:
243
t
0
:
025
;
25
:
(Variety
D-variety E)
5.809
5.964
Varieties are
different
s
1
r
i
þ
1
r
i
0
Thus, variety B is the variety giving signifi-
cantly the highest grain weight per hill followed
by variety A and variety C, which are statistically
at par.
¼
20
:
243
2
:
06
;
where
r
i
0
are the number of observations of
the two varieties under comparison. Thus, for
r
i
and