Environmental Engineering Reference
In-Depth Information
13
C
12
C
sample
13
C
12
C
standard
13
C
sample
1
1000
400
-7.6
Atmospheric CO
2
δ
13
C
≈
-8‰
390
-8.0
Photosynthetic
uptake
δ
Net CO
2
exchange
δ
13
C
≈
-27‰
13
C
≈
-26‰
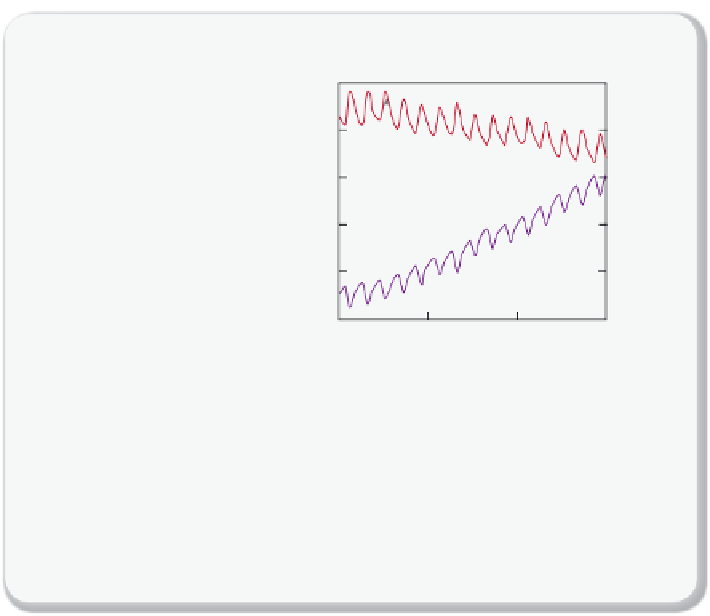
The lowest CO
2
level
each year is when the
δ
380
-8.4
13
C
value is the highest
370
-8.8
Respiration
δ
13
C
≈
-26‰
The highest CO
2
level
each year is when the
δ
360
-9.2
13
C
value is the lowest
350
-9.6
1991 1996 2001 2006
Year
(a)
(b)
Figure 2.4.15
Carbon-13 versus Carbon-12
(a) Plant photosynthesis discriminates against
13
C. Plant carbon tends to have less
13
C
than the CO
2
from which it is formed — fossil fuels are
13
C depleted!
(b) Experimental data of CO
2
levels correlated with the Carbon-13 ratio of the CO
2
.
Because of the combustion of Carbon-12 richer material, this ratio is decreasing.
Figure
redrawn from NOAA Earth System Research Laboratory
.
oxygen content of the atmosphere. If we burn fossil fuels, stoichiometry
tells us that for each molecule of CO
2
produced, we consume a molecule
of O
2
:
n
n
++
CH
1
O
→
CO
+
H O
n
2
2
2
4
2
If CO
2
is increasing, we should therefore expect the amount of oxy-
gen in the atmosphere to decline in exactly the same proportion as CO
2
produced. The experimental data in
Figure 2.4.16
indeed confi rm this.
When the dust has settled
We hope to have convinced you that the climate is changing. This con-
clusion started with a few scientists who proposed a very bold idea. This


Search WWH ::

Custom Search