Environmental Engineering Reference
In-Depth Information
20
15
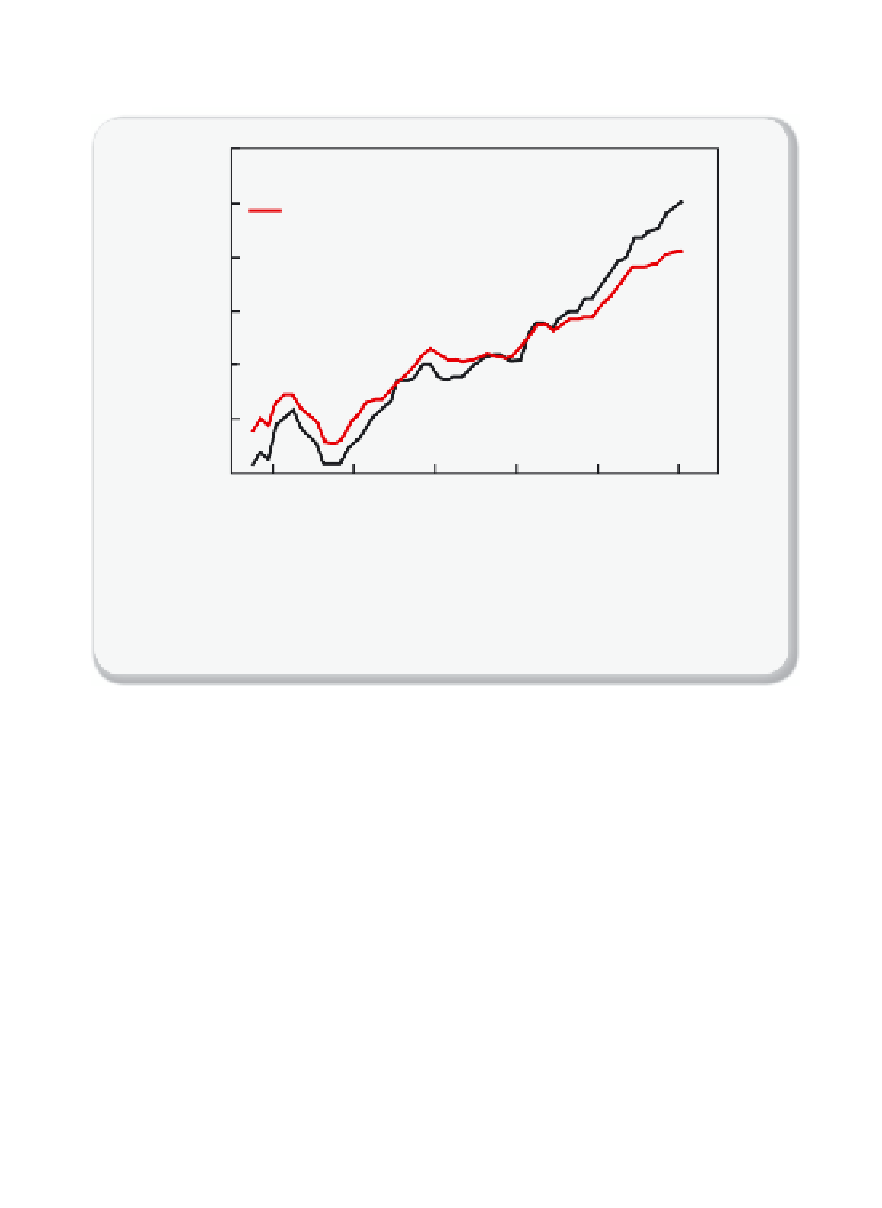
Pentadal average 0-700m through 2008-2012
Pentadal average 0-200m through 2008-2012
10
5
0
-5
-10
1960 1970 1980 1990 2000 2010
Year
Figure 2.4.5
World Ocean heat content
Time series for the ocean heat content for the 0-700 m below the surface (red) and 0-2,000
m (black) layers based on running pentadal (fi ve-year) analyses. The reference period is
1955-2006.
Figure adapted from NOAA/NESDIS/NODC Ocean Climate Laboratory
.
If the surface of the earth is heating, it would be logical that the
oceans would absorb some of the heat. Indeed, one of the conclu-
sions of the early studies on climate change was that the excess heat
must primarily be accumulating in the oceans [2.7]. This initiated an
experimental effort to measure the global sea heat content. The sci-
entifi c challenge is to fi nd the historical temperatures of the subsur-
face of the oceans [2.8].
Figure 2.4.5
shows some recent experimental
data [2.6].
Figure 2.4.5
shows that the heat content of the ocean is steadily
increasing. Consistent with global atmospheric warming, most of the
heat is stored in the upper 700 m and slowly mixes to greater depths. If
we assume a linear increase with a rate of 0.43 × 10
22
J per year in the
1955-2010 period, the total increase in the heat content is 24 × 10
22
J
and the mean increase in temperature is 0.09°C.
Figure 2.4.6
shows that
all oceans contributed to this heating.


Search WWH ::

Custom Search