Environmental Engineering Reference
In-Depth Information
240
H
2
O
H
2
O
200
CO
2
O
3
160
300 K
120
275 K
80
250 K
225 K
40
200K
0
5
6
20
10
50
8
Wavelength (µm)
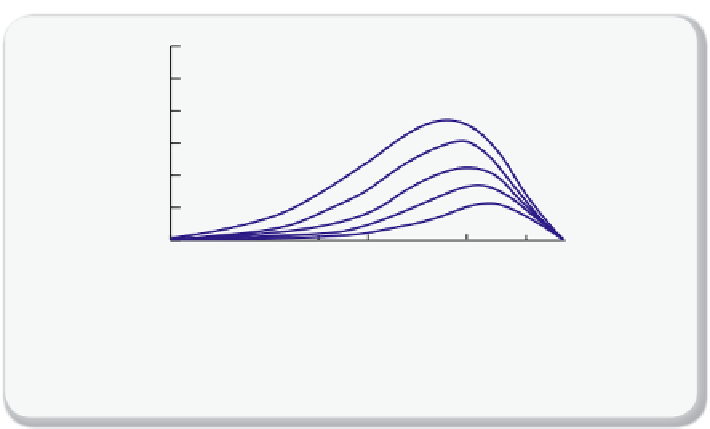
Figure 2.3.3
Absorption spectrum of the atmosphere
Details of the absorption spectrum of the atmosphere and the contributions of the vari-
ous chemicals. The blue curves are the emission spectra at the indicated temperatures
and black and grey curves the absorption spectra of the atmosphere.
coeffi cient will have a smaller effect. So chemicals that absorb at the
same wavelength as water can be very strong greenhouse gasses, but
their effect will be modest because water already is prevalent in the
atmosphere. If, however, we add a gas that is strongly absorbing at a
wavelength where the atmosphere is transparent, it will have a very
strong effect. This is exactly the case with CO
2
and CH
4
, which makes
them strong greenhouse gasses.
The other important factor is the length of time that gasses reside in
the atmosphere. A chemical can be a very strong greenhouse gas, but if
this chemical is only stable for a few days, its effect will be much smaller
compared to that of chemicals that persist for many years.
Table 2.3.1
shows some of these lifetimes; we see that CO
2
will be present in the
atmosphere for a very long time. In the next chapter, we will explain why
this time scale is so long.
Let us now summarize this section by making the previous discussion
more quantitative. In
Figure 2.3.3
we look at the outgoing radiation from
the earth (the earthshine), as if we are sitting at the outer edge of the
atmosphere and looking down at the earth. We have identifi ed the main
components that are responsible for the absorption at a given wavelength
and we have also shown the wavelengths at which the earth is transmit-
ting. Let us now increase the CO
2
level in the atmosphere. We see that at
15
µ
m less radiation will pass, which will increase the temperature of the


Search WWH ::

Custom Search