Environmental Engineering Reference
In-Depth Information
porosity 0.4
porosity 0.1
radius 10 m
radius 100 m
base scenario
permeability 1×10
-11
m
2
permeability 1×10
-10
m
2
permeability 1×10
-9
m
2
anisotropy 10:1
anisotropy 100:1
anisotropy 1000:1
infiltration 0.0 m/yr
infiltration 0.5 m/yr
infiltration 0.02 m/yr
10
-4
10
0
Mole fraction 0.3
10
-5
10
-1
10
-6
Typical Ecological Flux
10
-7
10
-2
10
-8
10
-3
10
-9
10
-10
10
-4
10
4
10
5
10
6
10
7
10
4
10
5
10
6
10
7
Leakage rate of CO
2
(kg/year)
Leakage rate of CO
2
(kg/year)
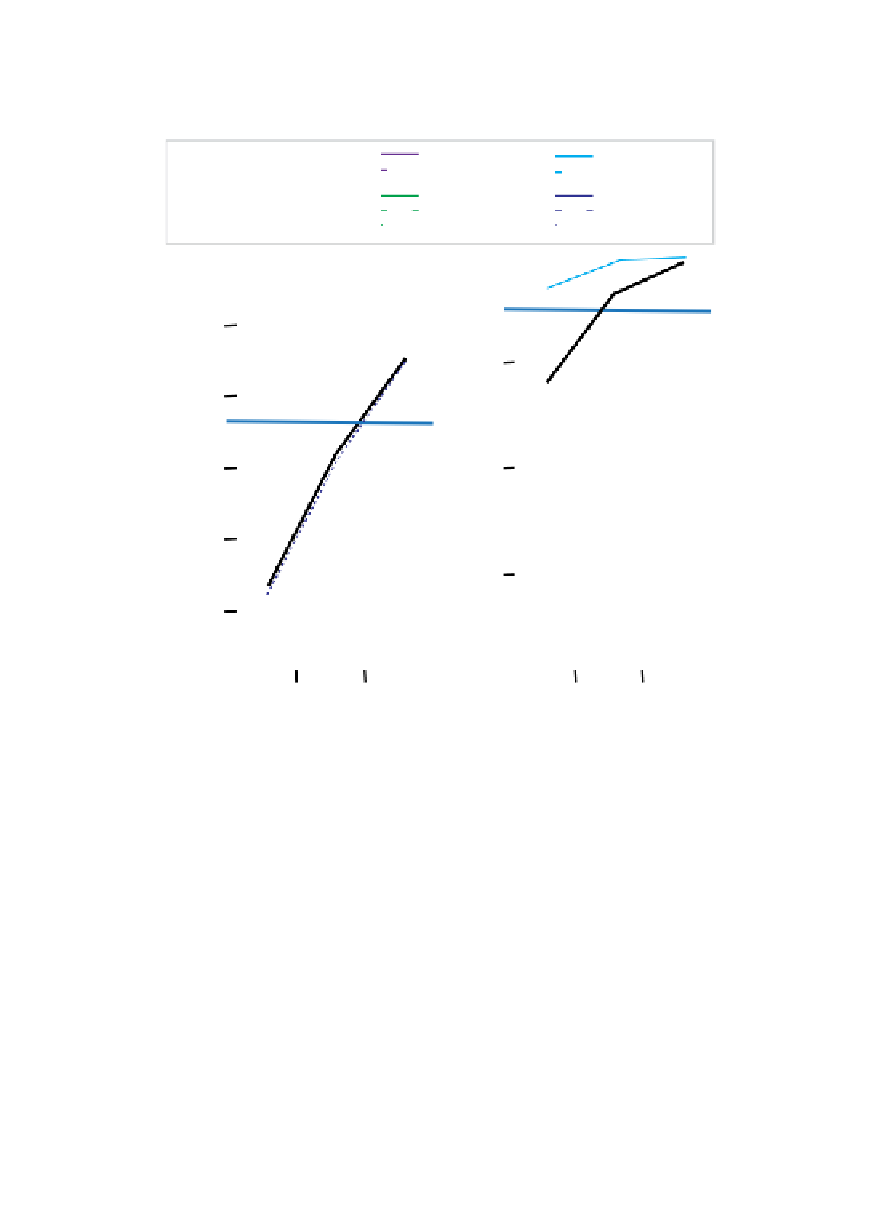
Figure 10.4.5
Simulation of CO
2
migration
Results of simulations of CO
2
migration in the vadose zone showing (a) maximum seepage
fl ux including effects of variable permeability, infi ltration of rainwater, porosity, and radius of
the leakage area, with typical ecological fl ux shown by the horizontal blue line, and (b) maxi-
mum near-surface concentration of CO
2
in soil gas. The mole fraction equal to 0.3 is high-
lighted because at this concentration trees died at Horseshoe Lake, CA.
Figure redrawn
from Oldenburg and Unger
[10.43].
gas at ambient conditions relative to air; as such it will tend to hug the
ground and occupy low spaces. While normally associated with decreased
mixing, dense gasses can also mix more effectively because they have
their own inherent gravity driving force relative to passive gasses. The
thought experiment shown in
Figure 10.4.7
elucidates this concept.
Briefl y, a density contrast between two gasses can, in many


Search WWH ::

Custom Search