Environmental Engineering Reference
In-Depth Information
2100
Eau Claire
2200
Upper
Unit
Mount Simon
2300
Middle
Unit
2400
Arkosic Unit &
Injection Interval
2500
PreCambrian
2600
0
0.05
0.1
0.15
0.2
0.25
0.3
Porosity
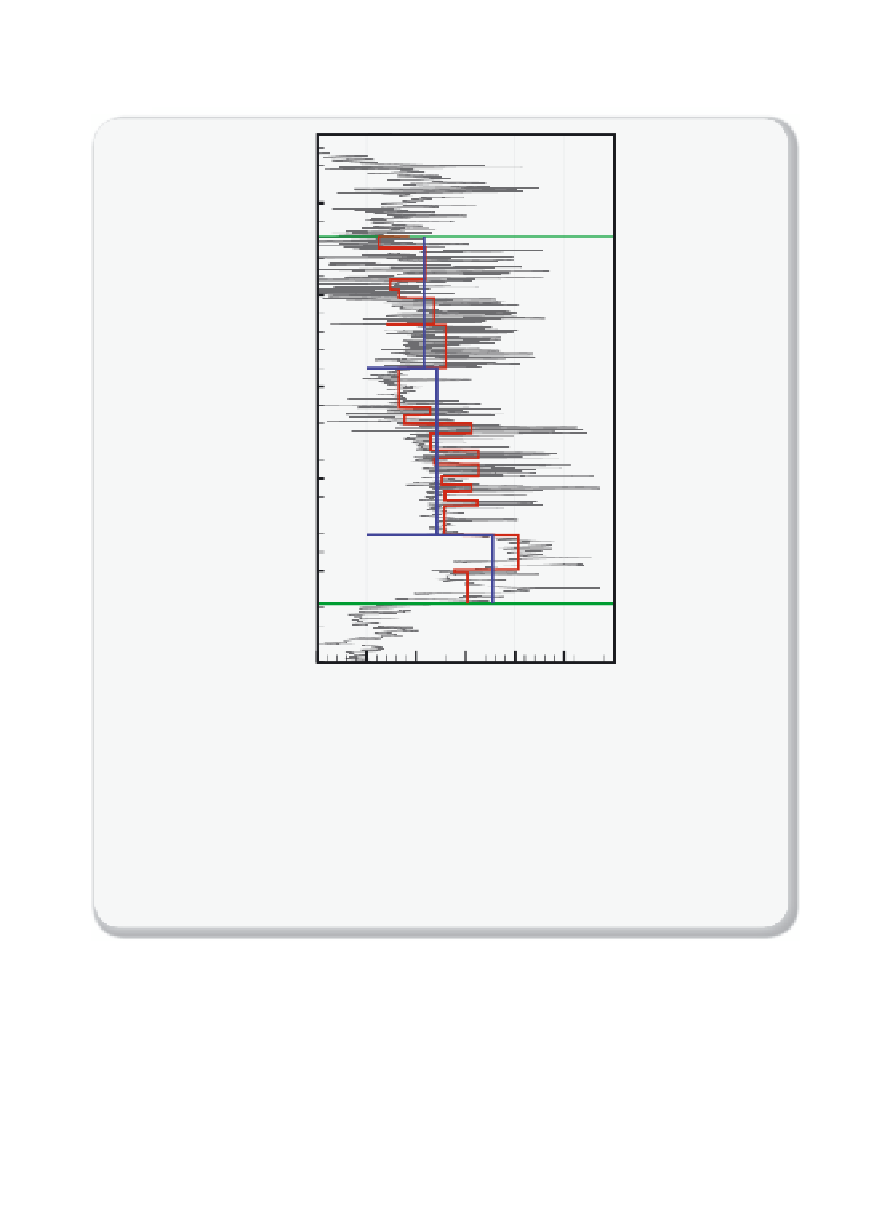
Figure 10.2.5
Well log measurements of porosity
Well log measurements of porosity (thin gray lines) vs. depth in the Mount Simon sand-
stone, a target sequestration formation in Illinois. The fi gure also shows measurements
from a portion of the overlying Eau Claire shale (the caprock) and from the underlying
PreCambrian granite. The red lines show the simplifi ed model of sandstone strata used
in the fi eld-scale sequestration model of Zhou
et al
. [10.4]. The blue lines show an even
more simplifi ed model in which the sandstone formation is described as only three units.
Figure reproduced from Zhou et al.
[10.4],
with permission from John Wiley and Sons
.
For combinations of species other than water, CO
2
, and simple salts
such as NaCl at conditions relevant to sequestration, thermodynamic
databases are incomplete. For example, experimental data are lacking
on the behavior of CO
2
-H
2
S or CO
2
-SO
2
mixtures in equilibrium with
water. This is an important knowledge gap to fi ll; the co-injection of H
2
S
or SO
2
with CO
2
could signifi cantly improve the economic viability of
sequestration when applied to the combustion of sulfur-rich coal and


Search WWH ::

Custom Search