Environmental Engineering Reference
In-Depth Information
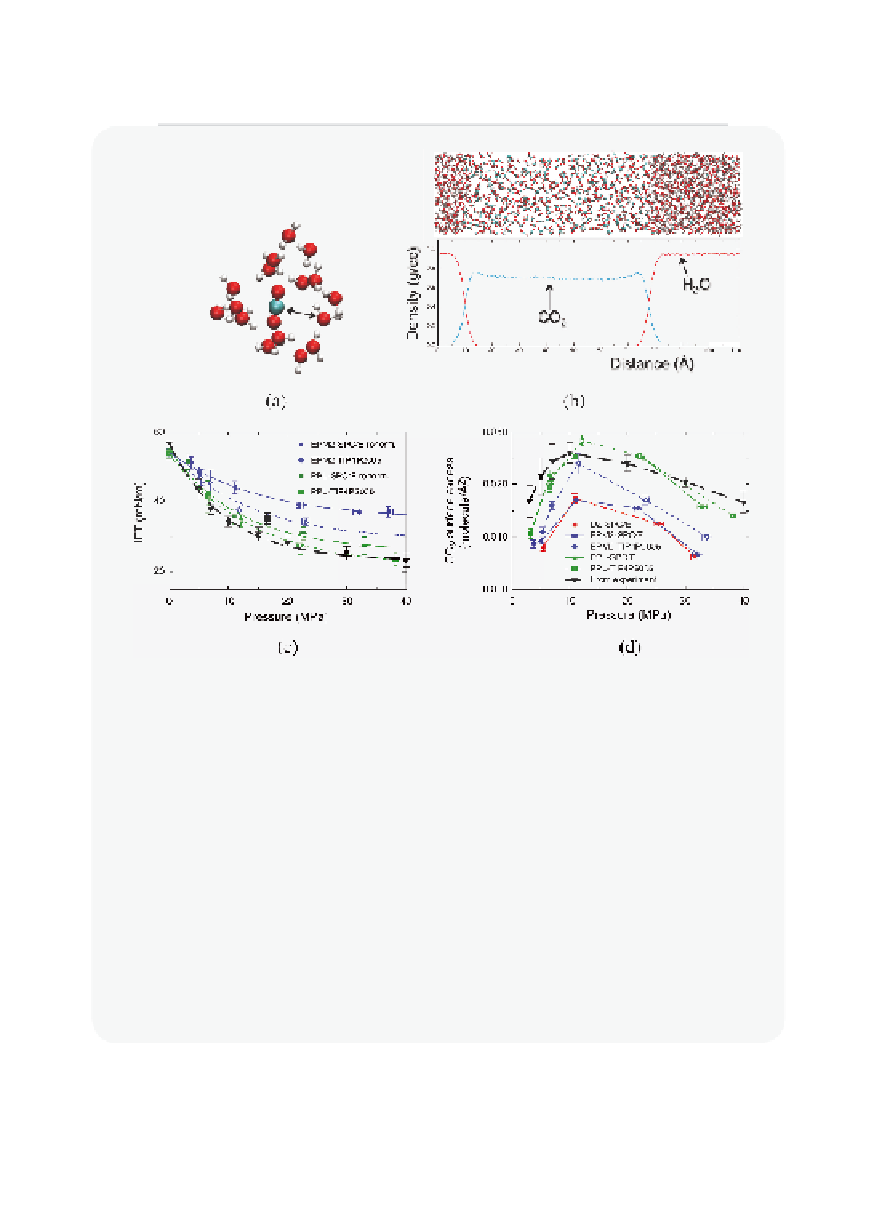
Figure 9.4.4
Molecular-scale predictions of the CO
2
-water interfacial tension
(a) Molecular dynamics (MD) simulation snapshot of a CO
2(aq)
molecule and the closest
water molecules (fi rst solvation shell).
(b) Snapshot of a simulation cell in which a region of supercritical CO
2
is in contact with
a region of liquid water. Average density profi les of water and CO
2
in the direction
normal to the CO
2
-water interfaces are shown below the snapshot.
(c) Interfacial tension
γ
gw
as a function of pressure at 373 K; the black triangles are
experimental values; colored symbols are MD simulation predictions obtained with
different CO
2
-water models.
(d) Density of CO
2
adsorbed on the water surface as a function of pressure at 373 K;
the colored symbols are MD simulation predictions; black triangles were deduced
from the experimental data in (c) using the Gibbs adsorption equation.
Figures reproduced from Nielsen et al.
[9.14]
.


Search WWH ::

Custom Search