Environmental Engineering Reference
In-Depth Information
Table 9.3.1
compares the density and viscosity of CO
2
at surface and
deep underground conditions with those of other gasses. Unlike CO
2
, meth-
ane and air are not supercritical at the deep conditions and therefore have
much lower (gas-like) densities. Because of the density increase for super-
critical CO
2
the viscosity also increases, yet the viscosity of supercritical
CO
2
is still about an order of magnitude lower compared to that of a liquid.
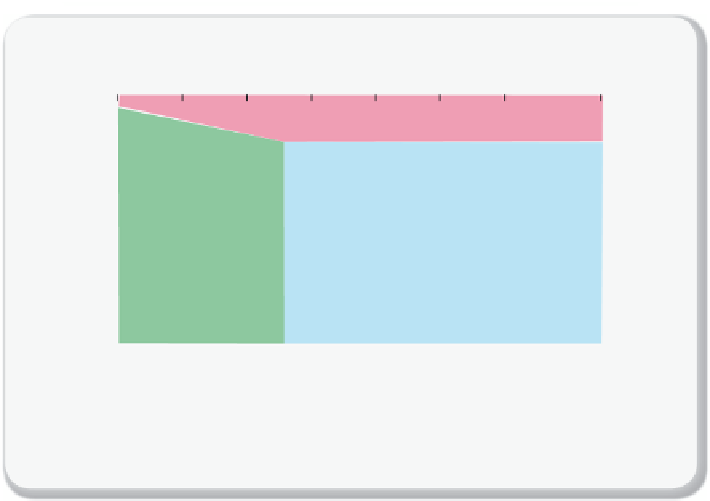
Figure 9.3.1
shows a modifi ed phase diagram convenient for under-
standing CO
2
properties in the subsurface as a function of pressure,
depth, and temperature. Superimposed on the diagram are the lines that
connect the temperatures and pressures for which CO
2
has a constant
density (isochores). In addition, the diagram shows two hypothetical
paths; one in which the temperature increases 15
°
C per km and one for
30
C per km, which are the typical temperature gradients found in differ-
ent geological formations. If CO
2
rises from the depths to the atmos-
phere, it will follow a path between these 15
°
C boundaries, and
we see that there is a narrow (green) triangular region where it may transi-
tion to a liquid. Furthermore, the upward migrating CO
2
will undergo a
large expansion, during which the Joule-Thomson effect will cause the
fl uid to cool. Both effects may result in the formation of a liquid with very
different properties from either gaseous or supercritical CO
2
[9.12, 9.13].
°
C and 30
°
Temperature (ºC)
−
20
0
20
40
60
80
100
120
0
4
20 kg m
-3
50 kg m
-3
100 kg m
-3
Gas
1
100
Liquid
2
200
3
300
Supercritical
4
400
Figure 9.3.1
CO
2
phase diagram
Inverted portion of the CO
2
phase diagram relevant to sequestration with superimposed
constant density lines (isochores) convenient for understanding phase conditions of CO
2
in the subsurface.
Figure reproduced with permission from Oldenburg
[9.11]
.


Search WWH ::

Custom Search