Environmental Engineering Reference
In-Depth Information
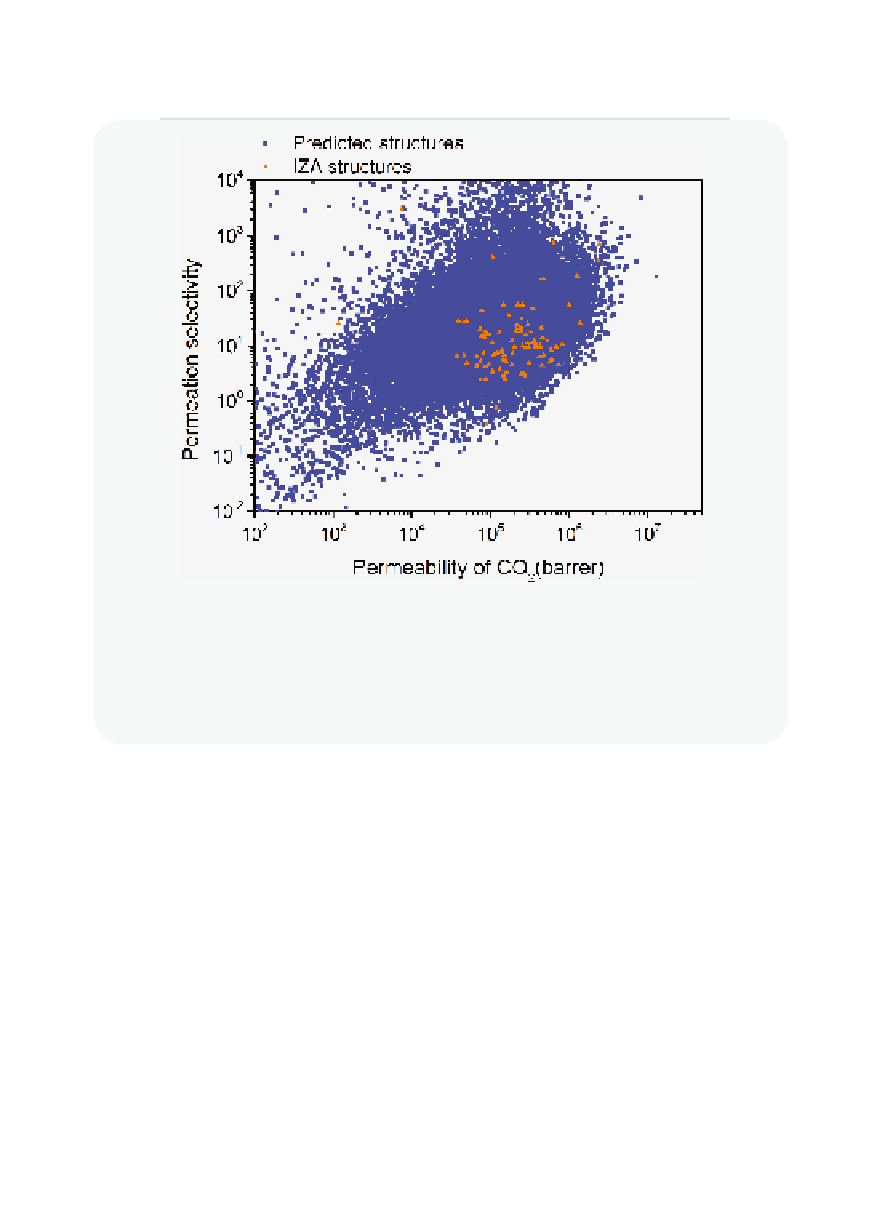
Figure 7.6.8
Robeson plot for zeolite structures
Robeson plot showing the CO
2
/N
2
permeation selectivity as a function of the CO
2
per-
meation for over 80,000 predicted zeolite structures (blue) and known zeolite structures
(red triangles).
Figure reproduced with permission from Kim et al.
[7.18].
how molecular simulations for some of the same materials can be used to
fi nd the optimal material for adsorption. We can use the same set of mate-
rials and predict the diffusion coeffi cient and Henry coeffi cient.
Figure
7.6.8
gives the corresponding Robeson plot for over 80,000 different zeo-
lite structures. Comparison with the Robeson plot for polymer materials
(see e.g.,
Figure 7.5.2
) shows that nanoporous materials indeed behave
differently; we do not observe the characteristic upper bound that is found
in polymer materials. The simulation results are surprisingly similar to what
we have predicted with our simple model (see
Figure 7.6.7
).
Selecting the best membrane
The Robeson plots are normally used to rank different materials, the ideal
material having a high selectivity and high permeability. This approach


Search WWH ::

Custom Search