Environmental Engineering Reference
In-Depth Information
50
100
40
Band of optimum
selectivity at a pressure
ratio of 5
30
10
20
10
0
1
1
10
100
1,000
10,000
1
10
100
1,000
10,000
CO
2
/N
2
selectivity
CO
2
/N
2
selectivity
(a)
(b)
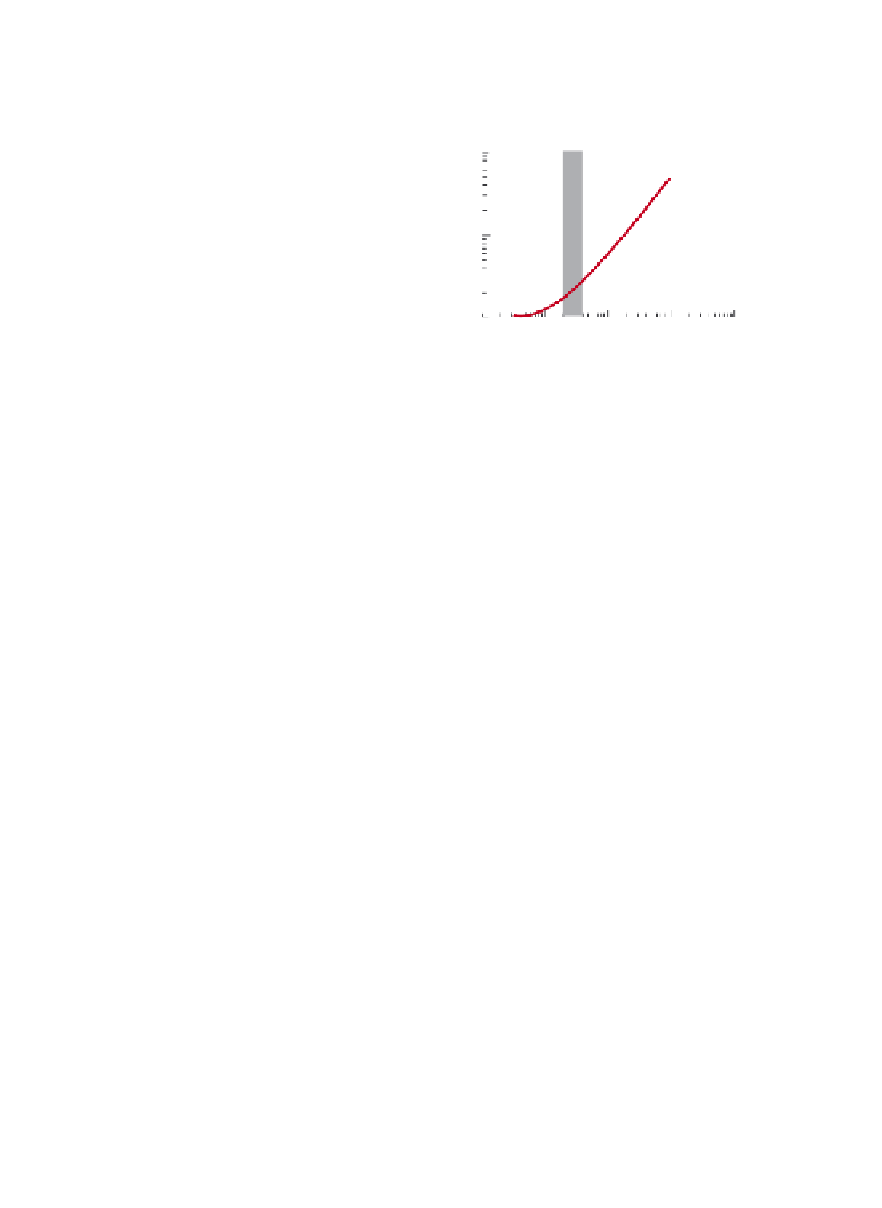
Figure 7.3.2
Permeate concentration or membrane area or/versus selectivity
Effect of CO
2
/N
2
selectivity on permeate CO
2
concentration (a) and relative membrane area
(b). For a pressure ratio of 5, optimum CO
2
/N
2
selectivity falls in a selectivity band between
20 and 40. The results are based on a stage cut of 1%.
Figures are redrawn from Merkel
et al.
[7.1]
, with permission from Elsevier.
equations derived previously to compute the area and compositions of
the permeate and retentate.
Merkel
et al
. [7.1] carried out these calculations, and the results are
shown in
Figure 7.3.2
, where the red curves are the solutions to the
equations and the hatched regions indicate those process conditions
that are economically available with commercial compressors and
pumps.
We see a few remarkable conclusions. First we need to stress that
our intuition for membrane separation is very poor. If we improve the
selectivity of our membrane while keeping the permeance for CO
2
con-
stant, we could in theory have a membrane that is nearly 100% selective.
Hence, our intuition would tell us that this is the perfect membrane for
which we can expect a permeate that is nearly 100% pure with the small-
est membrane area.
Figure 7.3.2
shows that we are wrong on both
accounts:
• the maximum purity we can obtain is only 50%.
• the
largest
membrane area is found for the membrane with the high-
est selectivity.
Clearly, we have to analyze our membrane separation in much more
detail to understand why our intuition is very wrong.


Search WWH ::

Custom Search