Environmental Engineering Reference
In-Depth Information
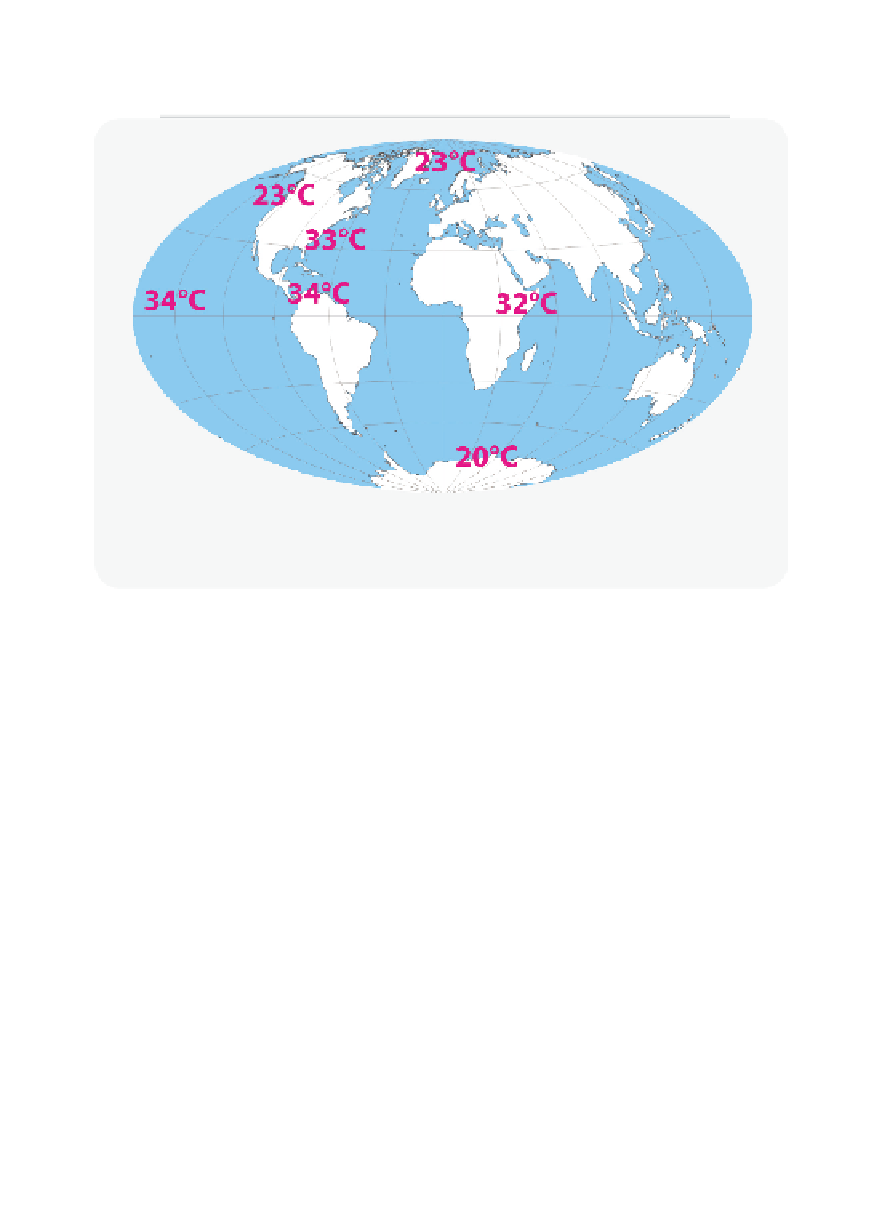
Figure 3.6.7
Average surface temperature of the earth during the peak of the PETM
The data for the temperatures are taken from
[3.16].
the buffer capacity of the ocean and lower its pH. As we have seen in the
previous section, such a low pH would dissolve the carbonate minerals
on the bottom of the ocean.
Figure 3.6.6
(bottom) shows that is exactly
what is observed.
There are many speculations in the literature about the source of the
enormous release of atmospheric carbon; it could have been methane
(CH
4
) from decomposition of clathrates on the sea fl oor, CO
2
from vol-
canic activity, or oxidation of sediments rich in organic matter. One of the
more recent theories posits that the magnitude and timing of the PETM
is related to the decomposition of soil organic carbon in circum-Arctic
and Antarctic terrestrial permafrost. This massive carbon reservoir had
the potential to repeatedly release thousands of petagrams (1 petagram
equals 10
15
grams) of carbon into the atmosphere-ocean system, once a
long-term warming threshold had been reached just before the PETM
[3.17]. The fi gures also show that eventually the carbon cycle of the earth
was able to remove the excess of carbon. The important thing to note,
however, is that it took 100,000 years before the earth recovered! The
crux of the entire analysis is depicted in
Figure 3.6.7
[3.16]. This fi gure
shows the reconstruction of the average temperature by regions at the
peak of the PETM. Study this fi gure closely, and overlay it with your own


Search WWH ::

Custom Search