Environmental Engineering Reference
In-Depth Information
Figure 3.6.5
Historical CO
2
levels and temperatures
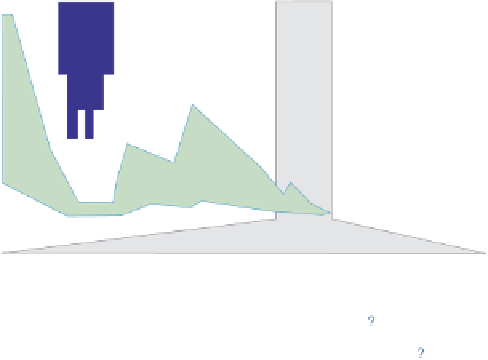
Top: Atmospheric CO
2
levels and continental glaciation from 400 Ma ago to present.
Vertical blue bars mark the timing and extent of ice sheets. Ice core experiments were
able to directly measure the CO
2
content in gas bubbles. In order to track the very early
CO
2
levels, we have to rely on proxies (
Box 3.6.1
). The plotted CO
2
records represent
fi ve-point running averages from each of the four major proxies. Also plotted are the
plausible ranges of CO
2
from the geochemical carbon cycle model GEOCARB III.
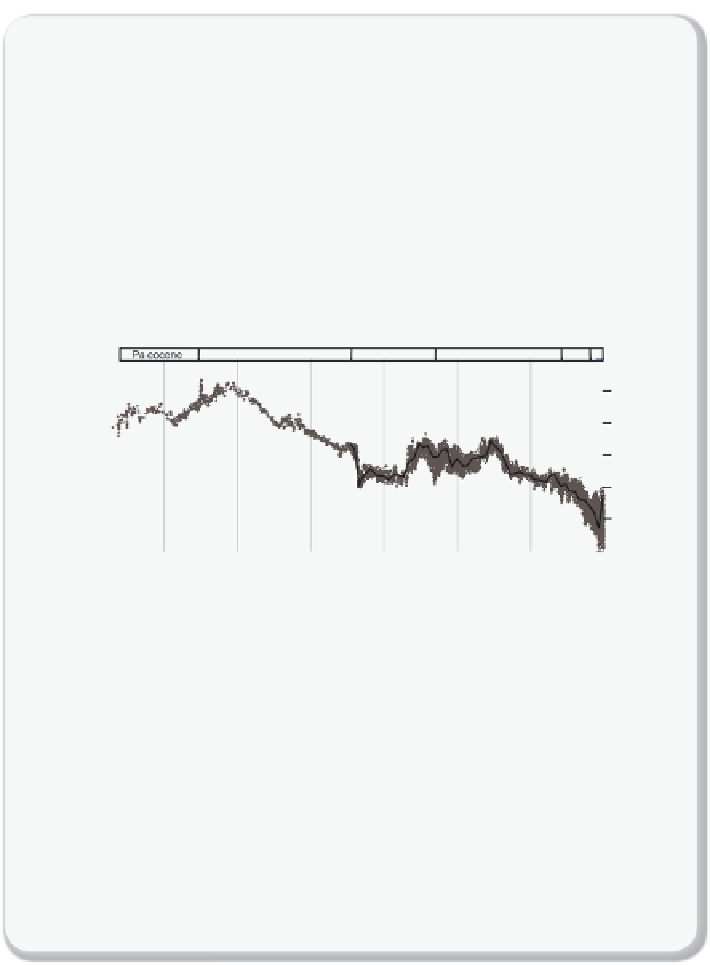
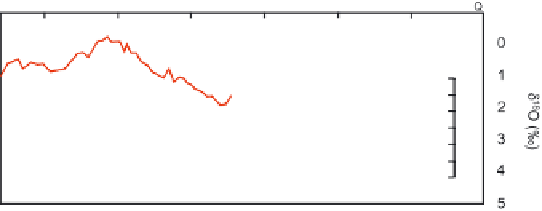
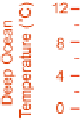
Bottom: The bottom graph zooms in on the most recent 60 Ma. The temperature proxies
that are plotted here are the deep-sea benthic foraminifera
18
O isotope records from
many different experiments. The bars on the upper right corners indicate the presence
of ice sheets. If the bars are dashed, they represent periods of ephemeral ice or ice
sheets smaller than those at present, while the solid bars represent ice sheets of modern
or greater size.
Figures from IPCC, reproduced with permission
[3.15].
show that in the early days of the earth CO
2
levels were much higher, as
discussed in Section 3.4. We see that the CO
2
levels have gone through
very large fl uctuations. We also see that the extent to which the earth was
covered with ice correlates inversely with CO
2
levels. In fact, by


Search WWH ::

Custom Search