Environmental Engineering Reference
In-Depth Information
(a)
(b)
(c)
(d)
(e)
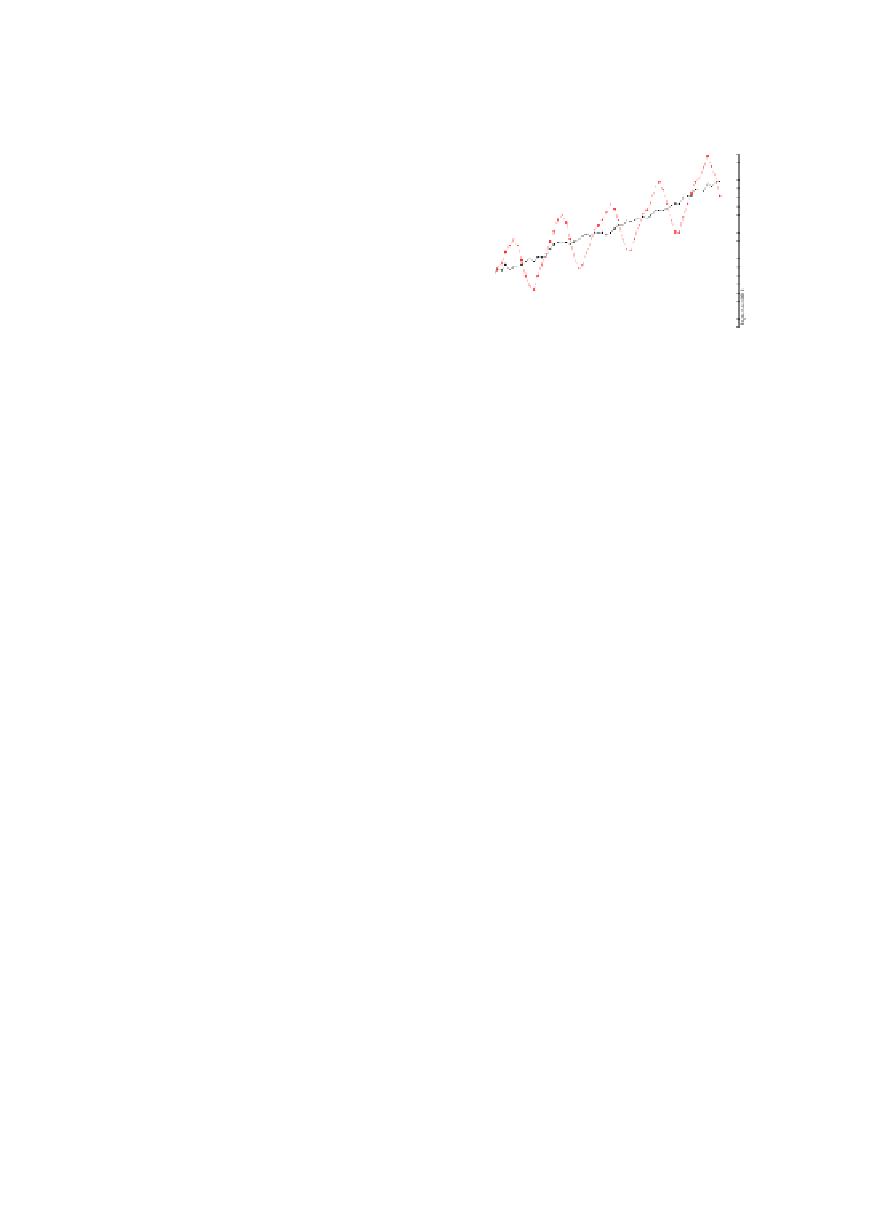
Figure 3.2.3
Atmospheric CO
2
Levels
(a) Historical CO
2
levels in the atmosphere as measured at the Mauna Loa Observatory.
Figure from Dr. Pieter Tans, NOAA/ESRL and Dr. Ralph Keeling, Scripps Institution
of Oceanography
[3.5].
(b) The data show the modulation of the CO
2
levels over a year. During the summer the
CO
2
levels are higher compared to the winter.
Figure from Dr. Pieter Tans, NOAA/
ESRL and Dr. Ralph Keeling, Scripps Institution of Oceanography
[3.5].
(c) Location of the Mauna Loa observatory in Hawaii.
Map data from Google
.
(d) Satellite picture of the island of Hawaii.
Picture from Earth Sciences and Image
Analysis, NASA-Johnson Space Center
.
(e) Mauna Loa Observatory.
Photo by NOAA/ESRL/GMD
.


Search WWH ::

Custom Search