Environmental Engineering Reference
In-Depth Information
Atmosphere: 600 Pg C
Terrestrial:
2,100 Pg C
Surface ocean: 700 Pg C
Deep ocean: 38,000 Pg C
Sediments and crust:
48,000,000 Pg C
Figure 3.1.2
Carbon reservoirs
System representation of the carbon reservoirs of the earth. Pg C is petagrams (10
15
grams) of carbon.
Figure based on data from Sigman and Boyle
[3.3].
5
4
Glacial-Interglacial
3
Human
perturbation
2
Annual
cycle
1
Diurnal
cycle
0
-1
-2
9876543210-1-2-3
Period [log (years)]
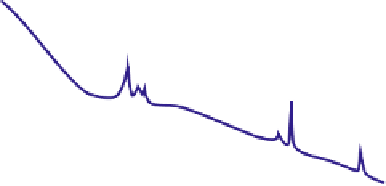
Figure 3.1.3
Fluctuation of the CO
2
concentrations in the atmosphere
Schematic variance spectrum for CO
2
over the course of the earth's history. The fi gure
illustrates the size and time scale of the fl uctuation of the CO
2
concentrations observed
in the atmosphere.
Figure adapted from Falkowski et al.
[3.2].


Search WWH ::

Custom Search