Environmental Engineering Reference
In-Depth Information
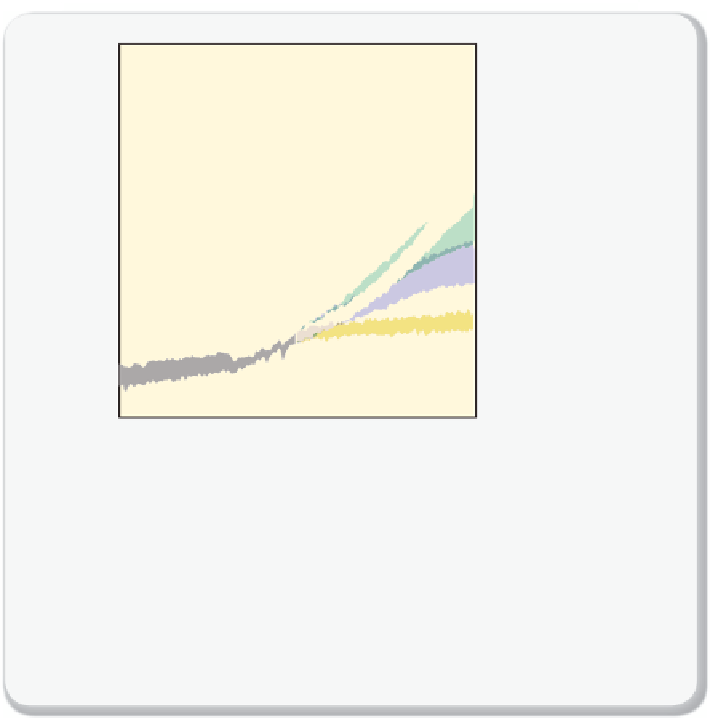
Figure 2.5.7
Predictions of global surface temperatures
Predictions of the change in the global surface temperature. The solid lines are multi-
model global averages of surface warming for scenarios A2, A1B, and B1 (see
Box
2.5.1
). The shading denotes the uncertainty in the model predictions. The orange line
represents a scenario in which the CO
2
concentration is held constant at its year 2000
value. The grey bars on the right indicate the best estimate (solid line within each bar)
and the likely range assessed for the six scenarios.
Figure
from IPCC, reproduced with
permission
[2.2].
how, for example, vegetation changed during the glacial and interglacial
periods.
It is interesting, however, to consider climate predictions for the
increase of the average temperature in the coming years and how this
might affects our ecosystems. We assume that a given biological species
needs a specifi c temperature range to survive; and thus, when the tem-
perature rises, they will need to move to higher latitudes or higher alti-
tudes. One can see that the rate of climate change determines how fast
these species will need to move in order to survive. How far they will need
to move depends further upon the local geography: on mountain slopes a
species has to move far less to reduce the temperature compared to on a
fl at area. If we combine a modest emission scenario (A1B, see
Box 2.5.1
)


Search WWH ::

Custom Search