Environmental Engineering Reference
In-Depth Information
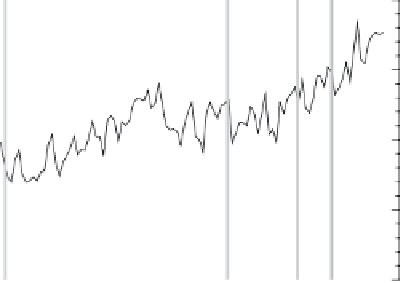
Pinatubo
Santa Maria
Agung
El Chichon
Figure 2.5.6
Temperatures on an earth without anthropogenic greenhouse gas
emissions
Comparison between global mean surface temperature anomalies (°C) from observa-
tions and climate model simulations without anthropogenic CO
2
emissions. The black
line represents experimental data. The thin blue lines are the results of 19 simulations
produced by 5 models with only natural forcings. The thick blue line is the average of
these 19 simulations. The thin vertical lines indicate volcanic events.
Figure from IPCC,
reproduced with permission
[2.2].
Future emissions
Future climate predictions are predicated on models for how humans
behave. In
Box 2.5.1
various scenarios of human behavior are discussed
[2.13].
Figure 2.5.7
shows the predictions of the average surface tem-
perature for each of the scenarios described in
Box 2.5.1
[2.2]. All sce-
narios give a signifi cant increase in global surface temperature. The
orange line describes a scenario in which the concentration of green-
house gasses is frozen at the 2000 level. Even in this case, the next two
decades will still show a warming trend. The reason for the delay
between the changes in the greenhouse gas emissions (e.g., ceasing all
CO
2
emissions) and changes in climate is the “lag time” owing to the
response of the oceans to changes in CO
2
levels. Similar predictions
have been made for the amount of sea ice (
Figure 2.5.8
) or sea levels
(
Figure 2.5.9
) [2.2]. The other important effect of climate change is the
occurrence of more extreme weather patterns. In
Figure 2.5.10
, the


Search WWH ::

Custom Search