Environmental Engineering Reference
In-Depth Information
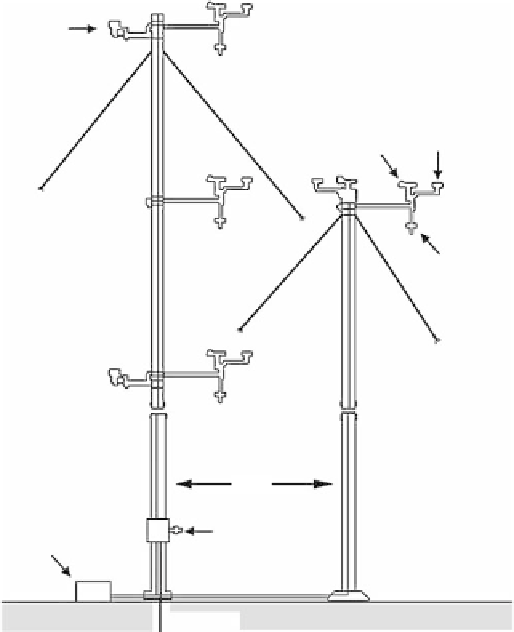
Temperature
probe
Direction
vane
Cup
anemometer
Guy
cable
Propeller
anemometer
40 m tower
30 m tower
10 m
Data
acquisition
system
Junction box
Ground rod
FIGURE 4.12
System for measuring turbulence.
developed and tested by Pacific Northwest Laboratory consisted of two towers and nine anemometers
(Figure 4.12), data sampled at 5 Hz. The propeller vane anemometers for horizontal measurements
were replaced by cup anemometers due to problems of maintenance and errors in measurement of
wind speed.
4.5.5 V
EGETATION
I
NDICATORS
Vegetation can indicate regions of high wind speed where there are no measurements available.
Deformation or flagging of trees [17, p. 96] is the most common indicator (
Figure 4.13
)
. In some
cases the flagging of trees is a more reliable indicator of the wind resource than the data available.
For example, the Arenal region of Costa Rica has high winds, which have now been measured
(average for twelve stations) at 11 m/s [29]. There is a meteorological station near Fortuna in the
region, which was primarily for collecting data for hydrology. The mechanical anemometer height
is less than 2 m, as they were interested in determining evaporation, and furthermore the station was
located close to trees. Therefore, that wind speed data indicated no wind power potential. However,
flagged trees in the area indicated high wind speeds.
The Griggs and Putnam Index [30] for flagging of coniferous trees (
Figure 4.14)
is related to the
annual mean wind speed [31] by
u 0.96 G 2.6
Search WWH ::

Custom Search