Environmental Engineering Reference
In-Depth Information
11
10
9
8
7
6
5
4
3
J
FMAM J
J
ASOND
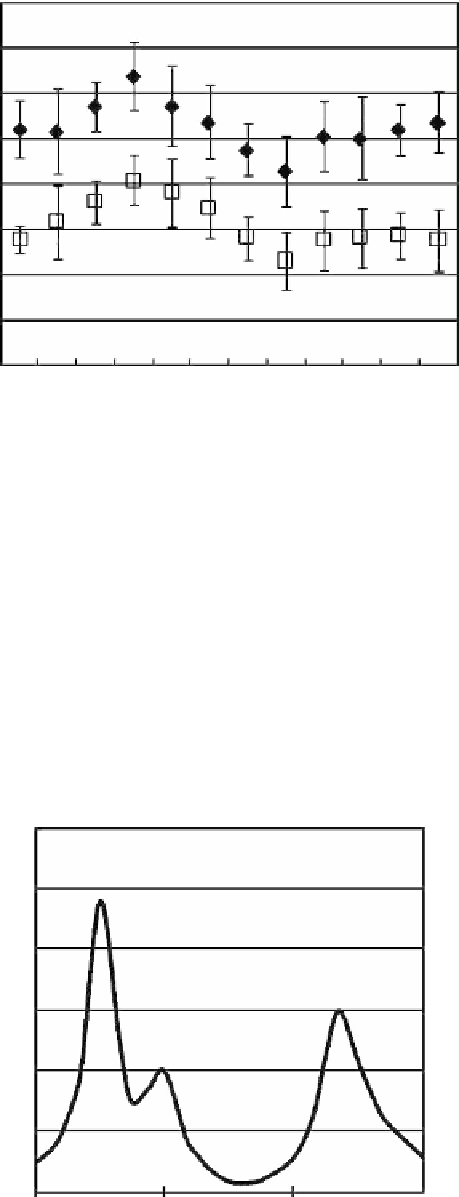
fiGurE 3.15
Annual wind speed and standard deviation by month at 50 m for White Deer, Texas, 1996-2006.
During the investigation of power storage for a wind/diesel system, an appropriate wind speed
power spectrum became a significant issue [8]. A power spectrum was developed from 13 years of
hourly average data, 1 year of 5 min average data, and particularly gusty days, and 1 s data, all at 10
m height. The general shape is similar to the Van der Hoven spectrum; however, few of his peaks
were found in the power spectrum at the U.S. Department of Agriculture, Agricultural Research
Service (USDA-ARS), Bushland, Texas. While higher average wind speeds tend to suggest higher
amplitudes in the high-frequency end of the spectrum, this is not always true. Similar results were
found for a power spectrum from 3 years of 15 min average data (sample rate, 1 Hz) at a 50 m height
near Dalhart, Texas (Alternative Energy Institute met site). For wind speed data around the 40 m
height, there would not be a diurnal peak in the continental areas of the United States. The Van der
Hoven spectrum is not really useful for the wind turbine industry.
6
5
4
3
2
1
0
0.001
0.1 10
Frequency, cycles/hr
fiGurE 3.16
Example of power spectrum for wind speed. (From I. Van der Hoven [7]. With permission.)
Search WWH ::

Custom Search