Environmental Engineering Reference
In-Depth Information
Hours
Energy
1000
600
900
500
800
700
400
600
500
300
400
200
300
200
100
100
0
0
0
5
10
Wind Speed, m/s
15
20
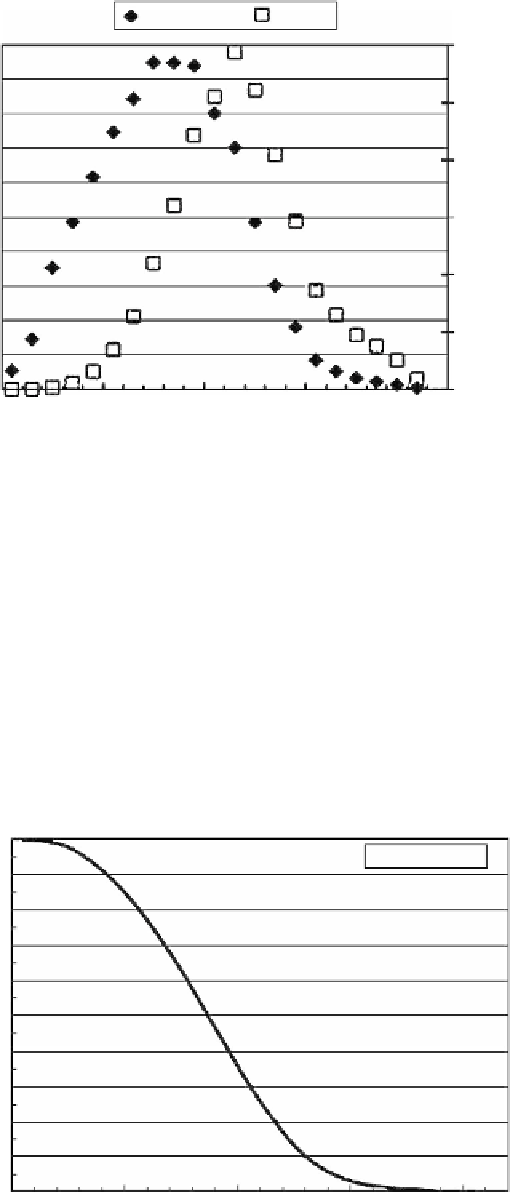
fiGurE 3.12
Annual average, comparison of wind speed and energy histograms at 50 m for White Deer,
Texas, 1996-1999.
3.9 duration CurVE
Wind data can also be represented by a speed-duration curve (Figure 3.13), which is a plot of cumu-
lative frequency starting at the largest wind speed (subtract 100 from percent frequencies of cumu-
lative frequencies if starting at the lowest wind speed). The percent duration is usually converted
(multiplying by 8,760) to number of hours in a year. From wind speed-duration curves, estimates of
the time the wind speed is above a given value can be obtained. The data in
Table 3.5
and the curve
in Figure 3.12 show, for example, that a wind of 3 m/s or greater blows 95% of the time, or 8,300
hours in a year for that location.
100
Series 1
90
80
70
60
50
40
30
20
10
0
0
5
10
Wind Speed, m/s
15
20
fiGurE 3.13
Wind speed-duration curve at 50 m height for White Deer, Texas, 1996-1999.
Search WWH ::

Custom Search