Environmental Engineering Reference
In-Depth Information
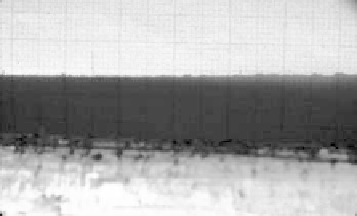
FIGURE 8.17
Ice on Carter 25 blade. Blades did not rotate at all with this much ice.
Accumulation of surface debris, caused by insects, grease, dust, and air pollution, on the leading edge
of blades causes energy losses, as noted by wind farm operators. A 60 kW wind turbine at USDA-ARS
showed a monthly energy loss of over 20%, and energy losses of 40% were observed when the wind
speeds were above 13 m/s [28]. Insects on the blades (Figure 8.18), like on the windshield of your car,
can reduce performance by 30% or more. Insects' impact on the leading edge can be severe; however,
data are difficult to obtain on amount and height of the contamination [29]. Adhesive tape was wrapped
around the leading edge of blades at equally spaced radial locations. Strips were collected and scanned
by laser profilometry. The results showed that grit can adequately model surface roughness for wind
tunnel and field testing. An artificial scale for roughness—light, medium, and heavy—was developed
by NREL from testing on wind turbines in California. This corresponded to using number 80 rock
tumbler grit at approximately 100-150, 250-300, and 500-600 particles per 5 cm
2
.
Power was measured for two 24-hour periods, with the data averaged over 5 minutes for the
Entertech 44, dirty blades, and then after a rain cleaned the blades (
Figure 8.19
)
. Insects on the
blades reduced the peak power by around 20 kW (
Figure 8.20
)
, a reduction of 40%. The power
curves for the data show the same information (
Figure 8.21
). This is another reason for wind farms
to have a baseline power curve for each turbine, and then weekly power curves can be compared to
that baseline for performance checks.
In California wind farms, after an insect hatch, they washed the blades (
Figure 8.22
) to improve
energy production. Active stall wind turbines attempt to compensate automatically for reductions
in power output in wind speeds above the rated wind speed. Since insects on the blade reduce
the aerodynamic efficiency, the active stall will compensate for this by changing the pitch angle
toward zero degrees. The compensation by active stall was evaluated on a NEG-Micon 72C wind
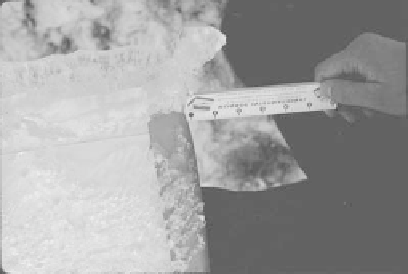
FIGURE 8.18
Left: Bugs on leading edge of PM blade. Right: Graph paper on ground shows shadow of lead-
ing edge bugs, which protrude 1 to 3 mm.


Search WWH ::

Custom Search