Environmental Engineering Reference
In-Depth Information
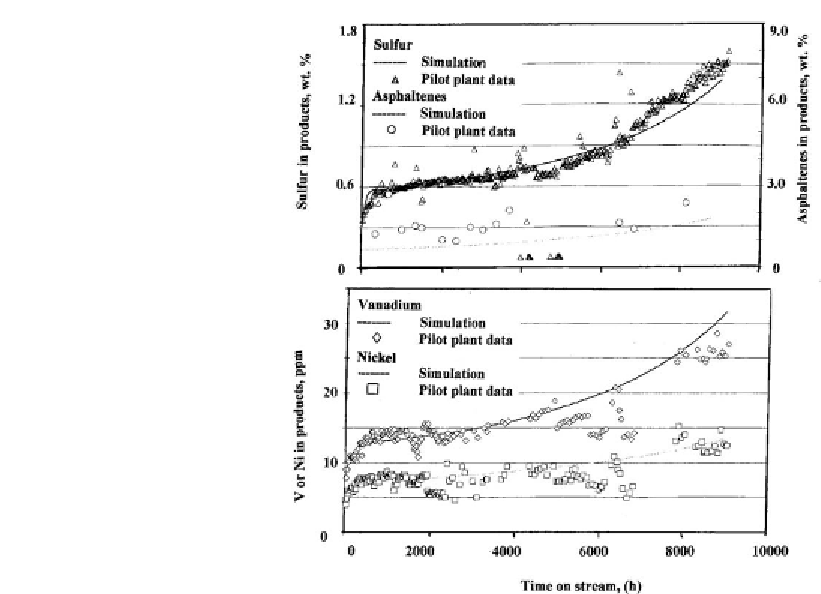
Figure 4.25: Comparison of pant data with simulation data for hydroprocessing atmospheric
residue [From ref.
284
. Reprinted with permission].
heavy feed via non-catalytic reactions. After applying this assumption, the prediction of the
catalyst performance beyond 4000 h significantly improved.
Figure 4.26
shows the prediction of catalyst performance using this model proposed by
Takatsuka et al.
[286]
. The properties of the catalysts are shown in
Table 4.4
. It was evident,
that initially, catalyst A was more active for HDS than catalyst C, as it was indicated by the
lower content of sulfur in the products. However, the activity of the former declined with time
on stream. The same catalyst was the least active for V removal. The best performance of the
catalyst B resulted from the optimal combination of pore volume, particle diameter and
surface area.
The percolation model based on the Bethe network
[287-289]
was used for the simulation of
reactor performance. It involves more than 50mathematical equations used to describe the
events occurring on an active phase level, as well as the transport-phenomena taking place on a
particle level. The trickle flow reactor, in which liquid and gases flow co-currently from the top
to the bottom through the void space between catalysts particles were used for modeling on the