Environmental Engineering Reference
In-Depth Information
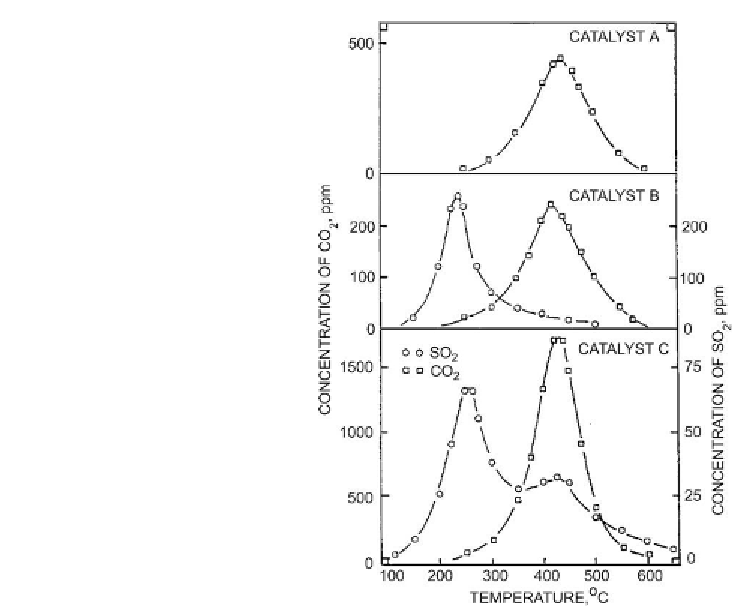
Figure 6.5: Formation of SO
2
and CO
2
during temperature programmed oxidation (TPO) of
spent catalyst [From ref.
369
. Reprinted with permission].
temperature region coincides with the formation of CO
2
and can be almost certainly attributed
to the oxidation of organic sulfur in coke. The catalysts in
Fig. 6.5 [369]
were crushed to
100-200mesh before TPO experiments to minimize the interference of diffusion. The trends
observed in
Fig. 6.5
are in agreement with the studies published by Zeuthen et al.
[370,371]
.
Matsushita et al.
[240]
evaluated the spent catalysts from the study of Hauser et al.
[238,239]
using the TPO technique. The spent catalysts were used for hydroprocessing the atmospheric
residue derived from a Kuwait crude. They were taken at different stages on stream during the
same operation. The TPO profiles (
Fig. 6.6
) revealed the two maxima of CO
2
formation, i.e.,
one at about 573 K and the other at about 700 K. These maxima were attributed to the
oxidation of a “soft” coke and a “hard” coke, respectively. It should be noted that in the study
of Seki and Yoshimoto
[208]
, the “hard” coke was defined as toluene insoluble portion of
coke. The “hard” coke studied by Hauser et al.
[239]
was much more refractory and was
adsorbed strongly on the catalyst surface. In its structure, the “soft” coke in the Hauser et al.
[238]
study may approach the structure of the toluene insolubles portion of coke formed