Chemistry Reference
In-Depth Information
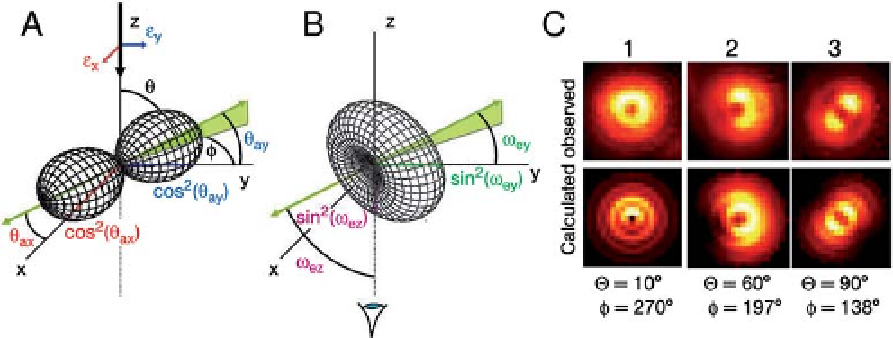
Figure 3.7 Relative probabilities for fluorophore
absorption (A, cos
2
the positive x axis),
q
ay
are angles between
the probe dipole and detector polarizations
along the x- and y-axes.
q
ax
and
q
a
) and collection of its
emission (B, sin
2
w
e
). In the microscope
coordinate frame (x, y, z), the optical axis is z. For
axial illumination (heavy arrow in A),
w
ez
are angles
between the probe dipole and detector optical
paths in the y- and z-axes. From Ref. [40] C,
defocused images of quantum dots (frozen in
1% polyvinyl alcohol) showing examples of
vertical, inclined, and horizontal emission
dipoles (upper row) and corresponding
calculated patterns (lower row). From Ref. [56].
w
ey
and
e
y
are
excitation polarizations. The probe absorption
and emission dipole moments (considered to be
parallel) in the (x, y, z) frame are defined by
e
x
, and
q
(axial angle) and
(azimuth: angle between the
projection of the dipole onto the x
f
-
y plane and
polarized
fluorescence cannot discriminate an angle (
q
,
f
) from the corresponding
angle (180
q
180
) in the opposite hemisphere. With excitation and emission
polarizations symmetrical about the x, y, and z planes, as in Figure 3.6, ambiguities
caused by the additional symmetries restrict the range of unambiguous probe
angular discrimination to 1/4 of a hemisphere, such as 0
,
f þ
90
and 0
90
.
<q<
<f<
45
angles) expand this range to a
full hemisphere [51]. This feature has been utilized to determine the handedness of
actin motion powered by myosin in vitro [51] and the path of myosin motors along
actin [52], as described later.
Additional incident polarizations in polTIRF (e.g.
3.2.8
Defocused Orientational and Positional Imaging (DOPI)
As mentioned, along with the polarization, the paths of emitted photons
carry information about the orientation of a
fluorescent dipole. The radiation pattern
can be detected by collecting an image slightly away from the sharpest focus [53, 54].
Some intuition into the cause of this behavior can be gained by considering the
distribution of photon paths from the
fluorescent dipole. Figure 3.7A shows a contour
surface representing the probability of photons absorbed or detected with polariza-
tions at angles
a
relative to the dipole axis, the cos
2
a
distribution. Photons with
polarization parallel to the dipole are preferentially absorbed and those polarized
perpendicular to the dipole are not absorbed. The distribution of radiation directions
q
q