Chemistry Reference
In-Depth Information
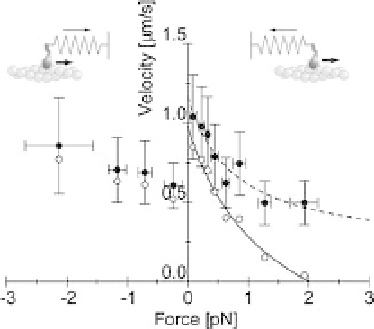
Figure 2.6 Force
velocity curve of individual myosin heads [25].
The velocity was obtained by dividing the step size, 5.5 nm, by
the dwell time (filled circles). Bars indicate the standard deviations
for 10
-
30 steps. Open circles indicate the velocity corrected by
the anisotropy of the stepping direction. The solid line shows the
Hill curve fitted to the corrected velocity.
-
backward directions at each force level, respectively. The values were corrected by
multiplying the velocities by the anisotropy of the stepping direction (Figure 2.6, open
circles). The positive force regions of this curve were in close agreement with the data
obtained in muscle [29].
The work done per 5.5-nm step (W
step
) was de
ned as the energy needed to pull a
linear spring (spring constant of a needle, k) over a distance of 5.5 nm from an initial
position, x, such that W
step
2
1
2
k
x
2
. We measured x during the dwell
time of the step from the equilibrium position of the needle. The mean of W
step
was
7.4 pN/nm (
¼
ðð
x
þ
5
:
5
Þ
Þ
¼
1.8k
B
T) and 4.0 pN/nm (
¼
1.0 k
B
T) at high and low needle stiffness,
respectively.
The velocity corrected for the stepping anisotropy had a hyperbolic dependence
when a positive force was applied. The data were well described by Hills equation
(solid line in Figure 2.6; (P
a)b where P is load, V, velocity, P
0
,
isometric force, and a and b are constants having the dimensions of force and velocity,
respectively). Maximum velocity (V
max
), isometric force (P
0
) and the curvature of the
hyperbola (a/P
0
) were determined to be 1.0mm/s, 2.0 pN and 0.7, respectively. V
max
at zero load was several times smaller than that of rabbit skeletal muscle. This is
because the sliding velocity of myosin is slowed by attachment to the large scanning
probe. P
0
was consistent with themean peak force. However, the value of a/P
0
, which
is a measure of the curvature of the force
-
velocity curve, was signi
cantly larger than
that of shortening muscle (0.2
-
0.4) [29]. One possible explanation for this difference
is that the force-generating step and other steps in the ATPase cycle, such as
association and dissociation of actin and myosin, are all involved during measure-
ment of a shortening muscle, giving the steeper force
þ
a)(V
þ
b)
¼
(P
0
þ
velocity curve. In individual
actomyosin motors, however, only the force-generating step is measured.
The mean work done per 5.5-nm step was determined to be 7.4 pN/nm (
-
1.8k
B
T)
at high needle stiffness. The number of steps per displacement was distributed from
¼