Chemistry Reference
In-Depth Information
Figure 2.5 (Continued )
scale, respectively. Displacements were not abrupt but took place in a stepwise
fashion. Most steps occurred in the forward direction but a small number were also
recorded in the backward direction. The size of the steps was determined by
computing the histogram of pairwise distances of all the data points of the stepwise
movements in the rising phases [18]. The stepwise data were corrected by using
the stiffness after the displacements reached a plateau (maximum) according to the
method described earlier. This is because the stiffness of an acto
-
S1 complex during
the rising phases could not be determined quantitatively due to the short dwell phase
of the steps, and because the stiffness in the rising phase was assumed to be the same
as that at the plateau. The power spectrum of the histogram had an obvious peak at
0.18 nm
1
. This corresponded to the periodicity of the peaks in the histogramwith a
spacing of 5.6 nm. The histogramof pairwise distances had a small peak near 5.5 nm,
corresponding to steps in the backward direction. The size of the steps (5.3 nm) at low
needle stiffness was almost the same as that (5.6 nm) at high needle stiffness. That is,
the size of the steps was independent of the load (0
-
2 pN), although the overall
displacement decreased at high needle stiffness due to a decrease in the total number
of steps.
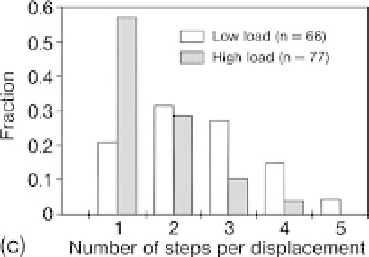
Figure 2.5c shows histograms of the number of steps per displacement at low and
high needle stiffness. The number of steps in a displacement varied from one to
ve