Chemistry Reference
In-Depth Information
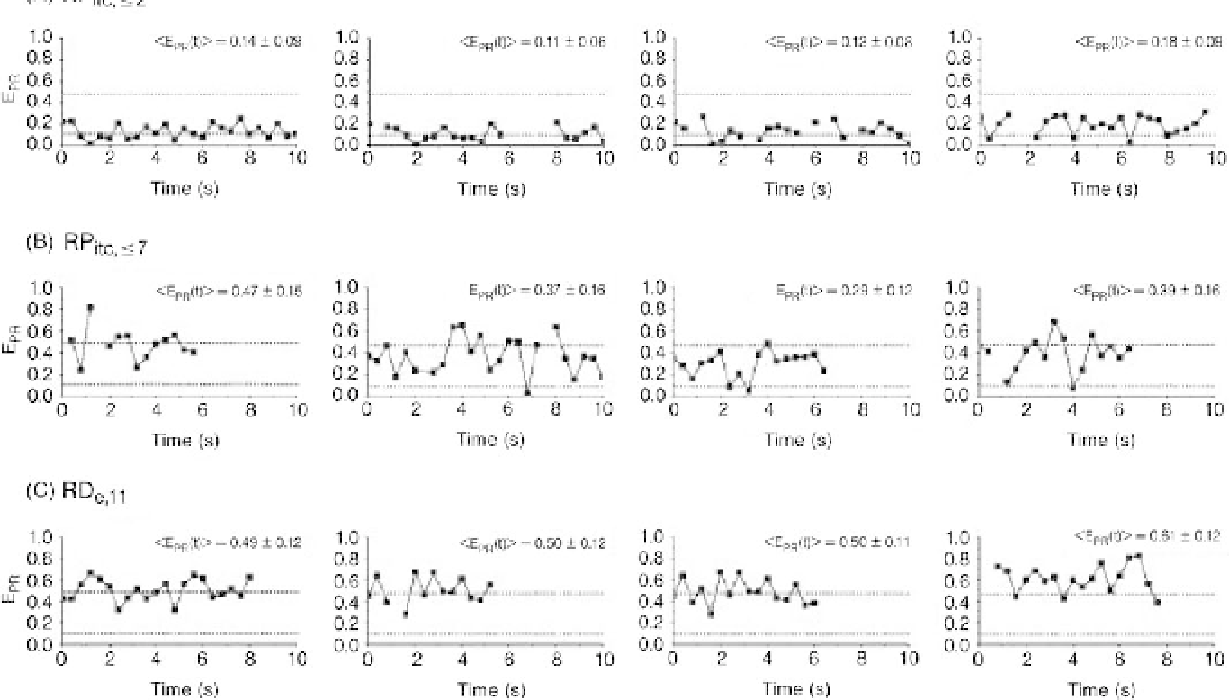
Figure 9.12 Single-molecule time traces of E are plotted as a function of time, for different representative RNAP
DNA
complexes. Only time points with active D and A are shown. The average E values obtained for RNAP allowed to progress
up to 2 bases RP
itc,2
and RP
e,11
(0.11 and 0.5, respectively) are represented by two horizontal lines to guide the eye.
(A) RP
itc,2
static distribution with
-
0.11. (B) RP
itc,7
, scattered distribution with a majority of time points distributed
around a relatively high E(t) value (distribution centered around
h
E
i¼
0.3 for the active molecules), consistent with the forward
translocation of the leading edge of RNAP relative to downstream DNA during abortive initiation. (C) RP
e,11
, static distribution
with
h
E
i¼
h
E
i¼
0.5. Reproduced with permission from [96].