Chemistry Reference
In-Depth Information
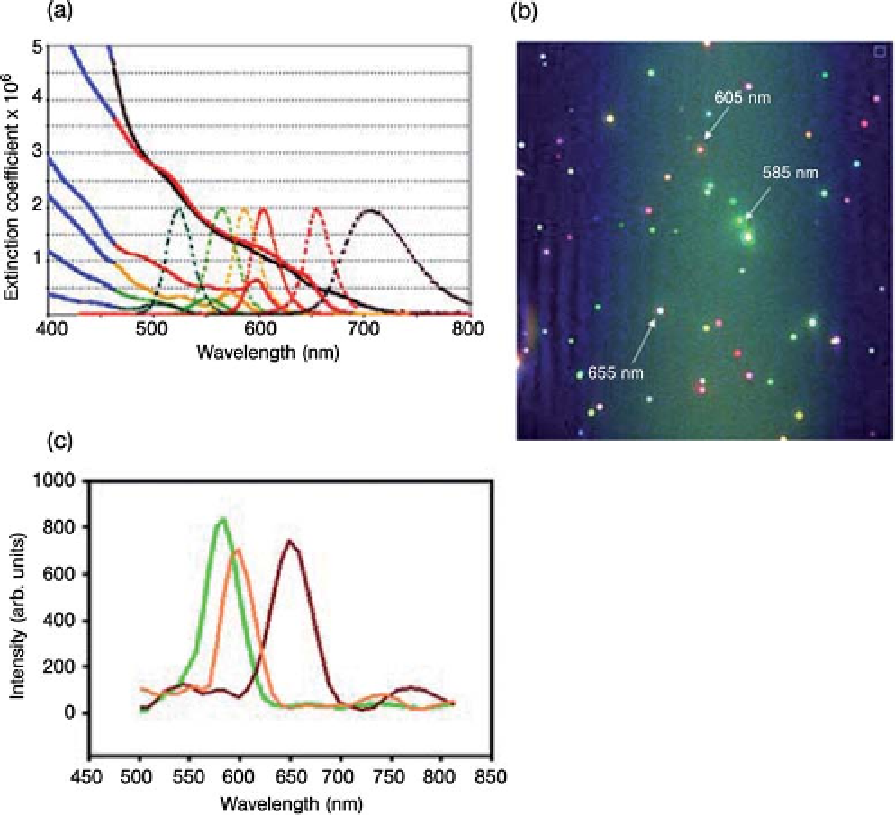
Figure 6.1 Absorption and fluorescence
emission spectra of commercially available QDs
in bulk solution, and hyperspectral image and
emission spectra of single QDs. (a) Excitation
spectra, solid curves; emission spectra, dotted
curves. Figure from Invitrogen, used with
permission. (b) Hyperspectral image of
fluorescence emission from single QDs in a
mixture as recorded with the Applied Spectral
Imaging SpectraCube. Colors in the image are
assigned by the spectral imaging software using
an arbitrary table and are not necessarily
representative of the true color of objects in the
image. (c) Fluorescence emission spectra of the
individual QDs indicated in panel b.
interior. Addition of complexes of QD
-
streptavidin conjugated with biotinylated EGF
at sub-nM concentrations results in rapid binding of the QD
EGF to receptors on the
-
cell body and along the
filopodia (Figures 6.2 and 6.3). In a previous study [3] Lidke
et al. showed that incubation of cells with 5 pM of QD
-
EGF for a fewminutes caused
individual QDs to attach to single EGFR molecules on
filopodia and undergo
diffusion. Addition of excess free EGF led to concerted activation of neighboring
receptors and the QD
-
EGF
-
EGFR complex, which immediately underwent directed
retrograde transport toward the cell body. An intact actin cytoskeleton as well as