Chemistry Reference
In-Depth Information
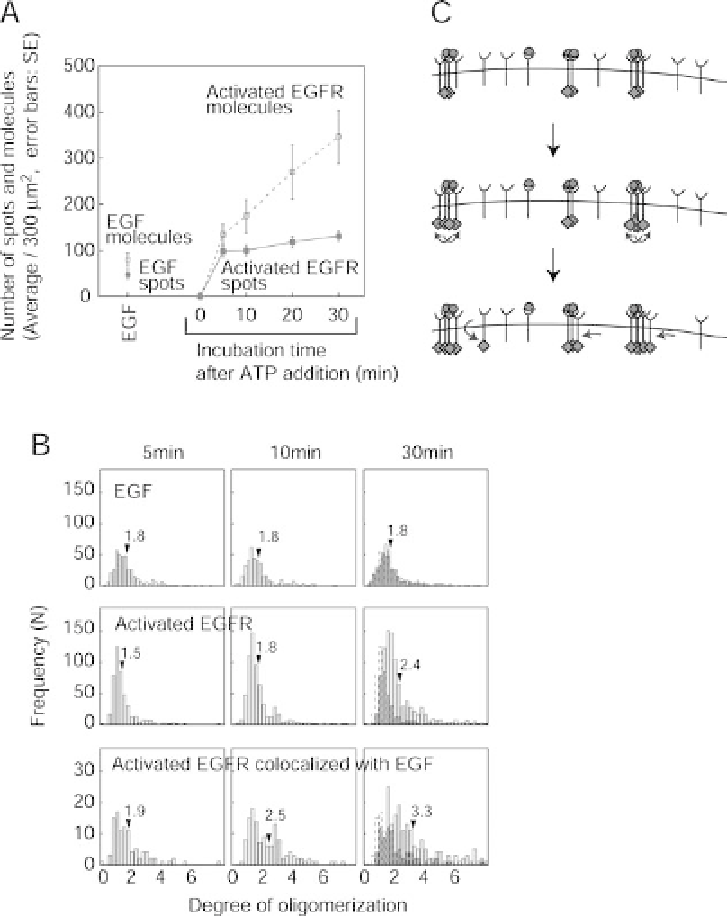
Figure 5.4 Single-molecule analysis of EGFR
activation. (A) Number of spots and molecules of
bound EGF and activated EGFR produced after
stimulation in semi-intact cells. Average and SE
for 11 cells are shown. See text for details of the
experiment. (B) Fluorescence intensity
distribution of the spots of EGF (top row),
activated EGFR (bottomrow), and activated EGFR
colocalized with EGF (bottom row) at indicated
time points after stimulation. Fluorescence
intensity (horizontal axis) was normalized with
respect to the intensity of single molecules.
Numbers above the arrowheads indicate the
average cluster size. (C) A schematic model of the
amplification process of EGFR activation through
the dynamic reorganization of EGFR.
The diffusion coef
cients for mobile phases, immobile phases and Cy3-NGF
xed
on a glass surface were 0.18, 0.02 and 0.01
ms
1
, respectively. Thus, even in the
immobile phase, molecules were still moving but more slowly than those in
the mobile phase by a factor of 9. The distribution of the durations of both mobile
and immobile periods
fit well to a single exponential function with decay times of
m