Chemistry Reference
In-Depth Information
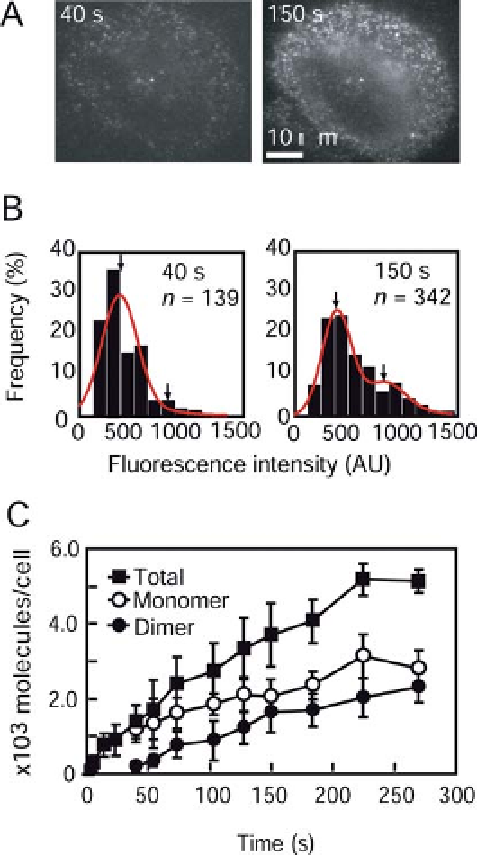
Figure 5.1 Single-molecule visualization of
Rh-EGF bound on the surface of a living cell.
(A) Rh-EGF was added to the extracellular
medium of cultured HeLa cells. Images taken 40
and 150 s after the addition of Rh-EGF (0.5 nM
final concentration) are shown. (B) Distribution
of the fluorescence intensity of Rh-EGF spots
bound to the cell shown in (A) at 40 and 150 s
after the addition of Rh-EGF. The distributions
were fitted to a sum of two Gaussian functions
(red line). Arrows indicate the mean of the
fractions containing one and two Rh-EGF
molecules. n
total number of spots. AU,
arbitrary unit. (C) The total number (closed
squares), monomers (open circles) and dimers
(closed circles) of Rh-EGF bound to the cellswere
counted at the indicated times. The average and
standard deviation of 10 cells are shown.
¼
examined after the addition of Rh-EGF to the culture medium (Figure 5.1). The
fluorescence intensity of single Rh-EGFmolecules was determined fromthe step size
of photobleaching observed under the same conditions. Early on, most of the
fluorescent spots contained single EGF monomers, but the fraction of EGF
dimers increased gradually with time. Thus single molecule visualization allowed