Environmental Engineering Reference
In-Depth Information
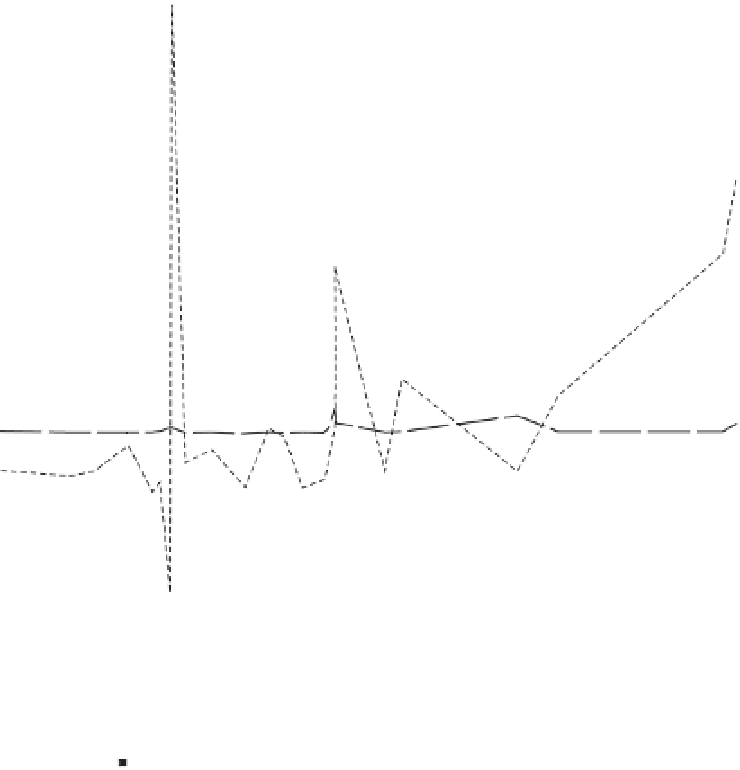
100,000
90,000
80,000
x
x
70,000
60,000
10
x
50,000
x
x
40,000
x
x
30,000
20,000
x
10,000
1
x
x
x
x
x
0
x
x
x
x
x
x
x
x
x
-10,000
-20,000
-30,000
-40,000
0.1
10/1
11/1
12/1
1/1
Month and day, 1999-2000
EXPLANATION
x
Streamflow (m
3
/s)
Suspended-sediment
concentration (mg/L)
Suspended-sediment concentration calculated from
weight density measured by Double Bubbler (mg/L)
(b)
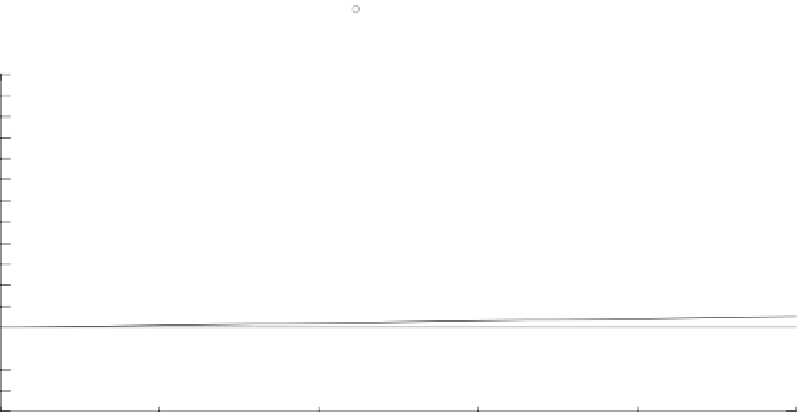
120,000
100,000
80,000
Line of equal value
60,000
40,000
20,000
0
-20,000
-40,000
0
1000
2000
3000
4000
5000
Suspended-sediment concentration (mg/L)
Fig. 1.18
Data for the USGS streamgage on the Rio Caguitas,
Puerto Rico, October 1999 to January 2000. (a) Time series of
streamfl ow, SSCs from samples, and SSCs calculated from
weight densities of suspended sediments and dissolved solids
measured using the Double Bubbler; symbols denote
measured values, dashed interpolation lines are included for
viewing purposes only; (b) scatter plot of measured SSCs
from samples and those calculated from the Double Bubbler.
Streamfl ow and sediment data are instantaneous samples,
and each Double Bubbler SSC value, calculated from weight
density, is a 30-minute mean of measurements made at
5-minute intervals.