Environmental Engineering Reference
In-Depth Information
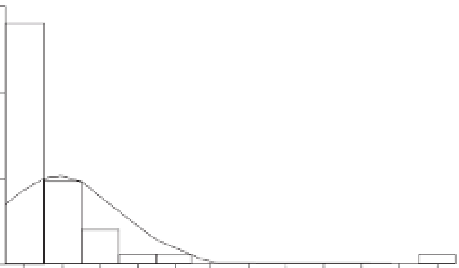
1 Sources
30
60
Polluted dusts, street dusts
Fluvial point sources
(Toxic tip and Bayton Rd)
Polluted dusts, street dusts
Fluvial point sources
(Toxic tip and Bayton Rd)
50
20
n
= 45
n
= 61
40
30
30
10
20
10
0
0
20000
30000
40000
50000
60000
70000
80000
90000 100000
0
0
10000
0
500
1000
1500
2000
2500
3000
3500
4000
4500
5000
5500
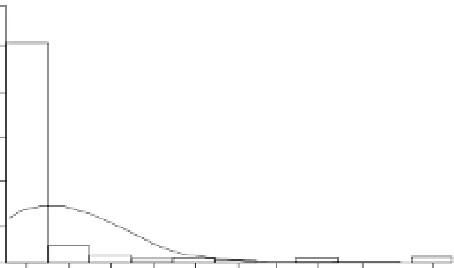
2 Transported
30
14
Storm sweres
Wyken Streams
River Sherbourne
Storm sweres
Wyken Streams
River Sherbourne
12
n
= 36
n
= 36
10
20
8
6
10
4
2
0
0
100
200
300
300
400
500
600
700
800
900
1000
1100
1200
1300
1400
1500
0
20
40
60
80
100
120
140
160
180
200
220
240
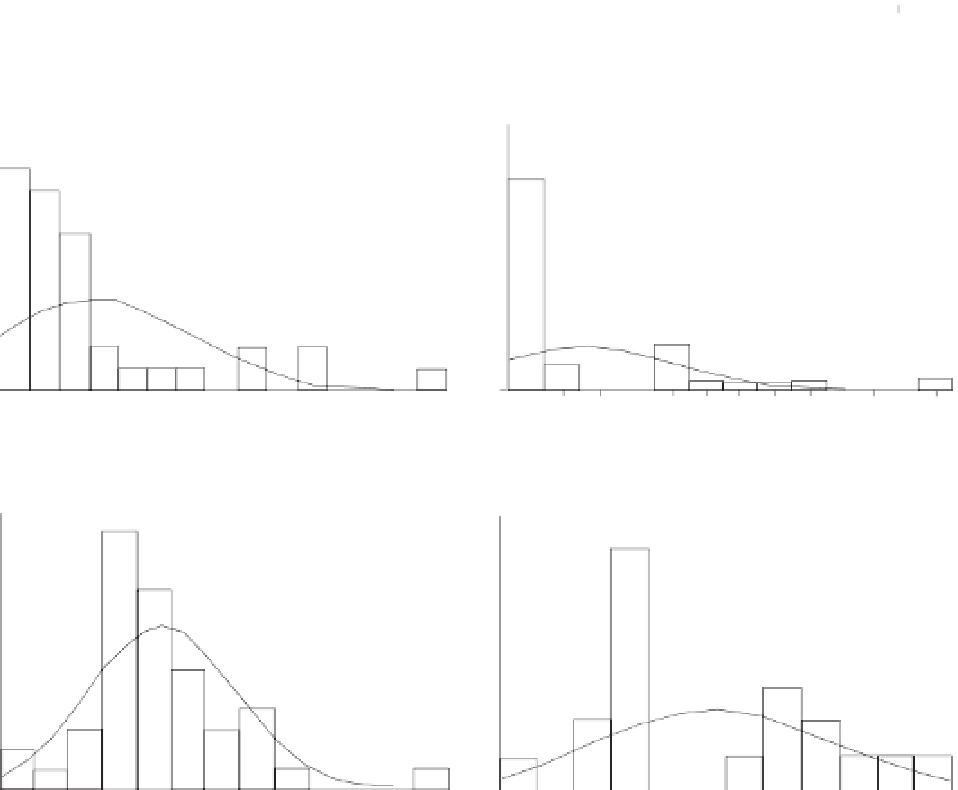
3 Deposited
14
8
William Morris Gully pots
Swanswell Gully pots
Wyken pool lake sediments
Swanswell pool lake sediments
n
William Morris Gully pots
Swanswell Gully pots
n
12
= 19
6
10
= 44
8
4
6
4
4
2
2
0
0
0
100
200
300
400
500
600
700
800
900
1000
1100
1200
75
100
125
150
175
200
225
250
275
300
325
350
mg kg
-1
mg kg
-1
(a) <63
μ
m copper
(b) <2 mm copper
Fig. 5.7
Frequency diagram for Cu in (1) sources, (2) transported, and (3) deposited sediments according to particle size
(a)
2 mm in samples from Coventry city centre.
From Charlesworth & Lees (1999).
<
63
μ
m (b)
<