Environmental Engineering Reference
In-Depth Information
Main clay
minerals
After heating
at 200 and 300 ºC
After heating at
550 ºC
Room
temperature
After EG saturation
d
= 7.15 Å
d
= 7.15 Å
Kaolinite
d
= 7.15 Å
disappears
Peak at
d
= 7 Å
After formamide
d
= 7.2 Å
d
= 10 Å
Halloysite
X-Ray
diffractogram
00l
region
Mica/illite
Peak at
d
= 10 Å
Samples
Ca and Mg
saturated
Smectite
d
= 17 Å
d
= 10 Å
After heating
at 300 ºC, K saturated
Peak at
d
= 14-15 Å
d
= 10 Å
Vermiculite
d
= 14-15 Å
After heating at 300 ºC
d
= 14 Å
d
= 14 Å
Peak 14 Å
Chlorite
Fig. 3.2
Schema showing the position of peaks of the most common clay minerals in X-ray diagrams after pretreatments.
From Bortoluzzi & Poleto (2006).
17.1 Å
-15.2 Å
10.0 Å
550
o
C
7.2 Å
200
o
C
'
EG
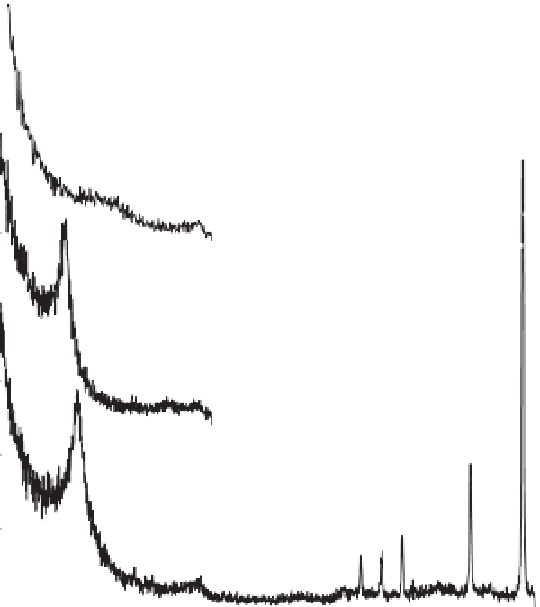
Fig. 3.3
X-ray diagrams of the less than
2
m fraction in an oriented deposit
under different treatments (N is at room
temperature; EG is with ethylene glycol
solution; heating at 200 and 550 °C).
Samples of fl uvial sediments in a
watershed in southern Brazil.
Adapted from Bortoluzzi (2004).
μ
N
5
10
15
20
25
30
35
40
2
q