Biology Reference
In-Depth Information
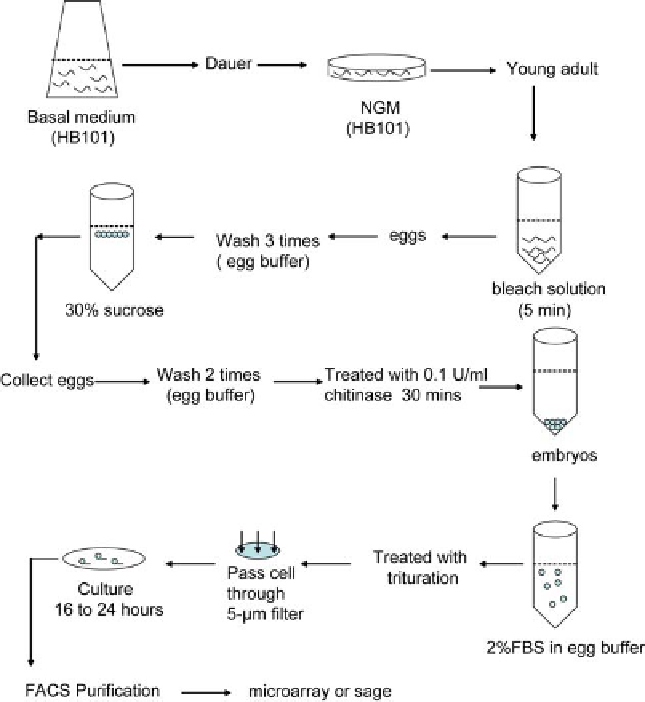
Fig. 5
A flowchart for isolating GFP positive neurons in gene profiling analysis. (For color version of
this figure, the reader is referred to the web version of this topic.)
min at 900g and redissolved in the egg buffer containing 2% FBS to 1-2
10
7
cells/mL concentration.
(3) FACS purification: GFP-positive cells are purified by flow cytometry. Dead
cells and debris are eliminated by a combination of light scatter and propidium
iodide negative gates. Cell sorting region for GFP-positive cells is defined by
green (530/30 nm) versus orange (575/22 nm) fluorescence and light scatter
gate.
(4) Microarray or SAGE analysis: After getting purified GFP-labeled neurons,
RNA isolation, microarray hybridization, and analysis will be applied to get
the expression profile of specific subgroups of neurons.
Search WWH ::

Custom Search