Environmental Engineering Reference
In-Depth Information
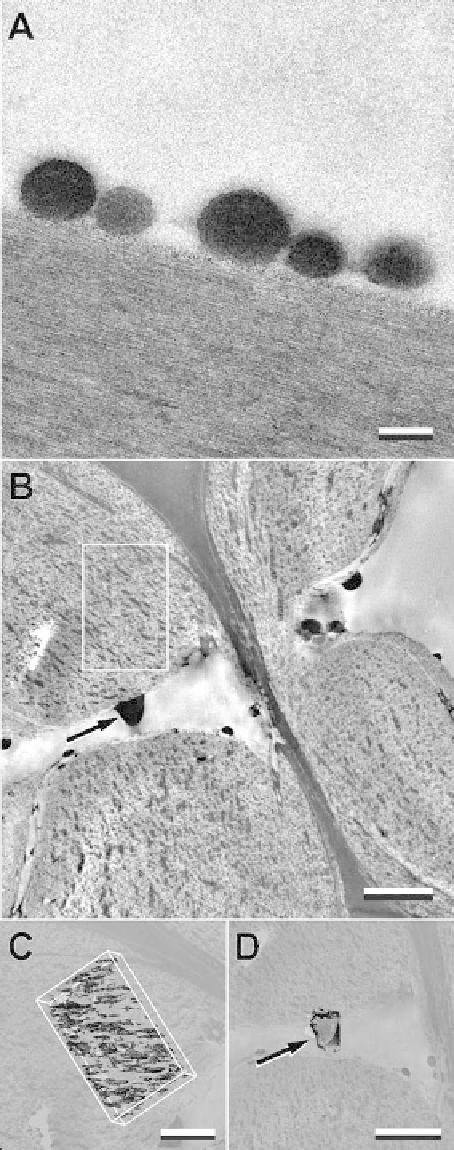
Fig. 1.4
TEM micrograph of
lignin droplets re-deposited
on cellulose surfaces after
being transported from the
cell wall matrix during high
temperature pretreatments
(
a
). Electron tomograph
images of coalesced lignin
within cell walls. The
boxed
region
in
b
has been
segmented to show the 3D
volume of coalesced lignin
(
c
). Large lignin globules can
form in openings like pits
(
arrow
b
,
d
). Scale
bars
200 nm
a
; 500 nm
b
,
c
; 200 nm
d
=
Search WWH ::

Custom Search