Database Reference
In-Depth Information
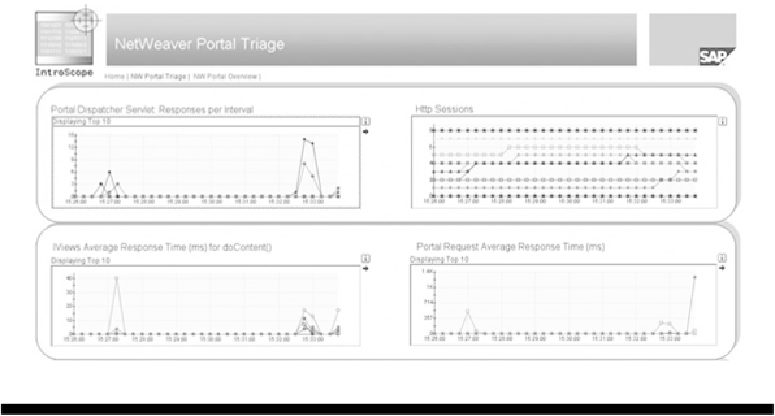
Once you are logged on, you can see different views (dashboards) of the satellite sys-
tems. The following illustration and
Figure 17-10
show the portal triage dashboard of one of
the monitored Java systems.
Copyright by SAP AG
F
IGURE
17-10
NetWeaver Portal triage real-time dashboard view
You can also generate a report of the monitored system by choosing Workstation | Gener-
ate Report. Next choose one of the available templates. In this example, a J2EE overview
template is chosen.
Figure 17-11
shows the generated report.