Environmental Engineering Reference
In-Depth Information
160
140
120
100
80
60
40
20
0
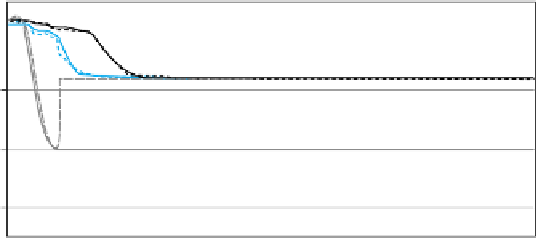
Figure 7.12. Changes in the
actual and equilibrium
concentration after 30, 60 and
90 days for a canal with
sedimentation control
(deepening).
1000
2000
3000
4000
5000
6000
7000
8000
9000
10000
0
Distance (m)
C-eq = 30
C-act = 30
C-eq = 60
C-act = 60
C-eq = 90
C-act = 90
160
140
120
100
80
60
40
20
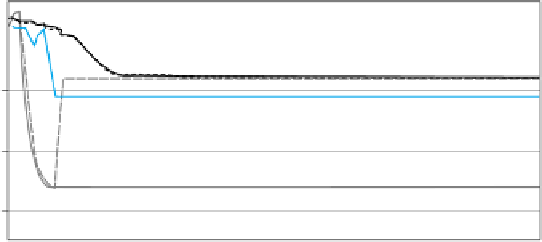
Figure 7.13. Changes in
the actual and equilibrium
concentration after 30, 60 and
90 days for a canal with
sedimentation control
(widening
B
1000
2000
3000
4000
5000
6000
7000
8000
9000
10000
0
Distance (m)
C-eq at 30 days
C-act at 30 days
C-eq at 60 days
C-act at 60 days
=
14 m).
C-e
q at 90 days
C-act at 90 days
The sediment trap gives small equilibrium concentrations and high depo-
sition volumes during the simulation period. At the end of the simulation
(90 days) the equilibrium concentration rises to the actual concentra-
tion and the point at which the sediment trap has to be cleaned becomes
critical.
The simulation results for the deposition due to the widening of the
first canal reach (Scenario 2 with
B
14 m) are shown in Figure 7.13.
The behaviour of the actual and equilibrium concentration is rather
similar to the one previously described (Scenario 1). The widening
shows more deposition than the deepening of the canal. The table shows
that the amount of sediment deposition per day for the canal without
=


Search WWH ::

Custom Search