Environmental Engineering Reference
In-Depth Information
Table 7.1. Equilibrium concentrations and total amount of deposited sediment as a function
of the relative discharge according to the Brownlie predictor.
Discharge (m
3
/s)
25.75
23.18
20.6
19.05
Rd
1
0.9
0.8
0.74
Equilibrium concentration (ppm)
108
91
77
70
Total volume of sedimentation (m
3
)
0
3 207
6 090
6 810
0.60
0.50
0.40
0.30
0.20
0.10
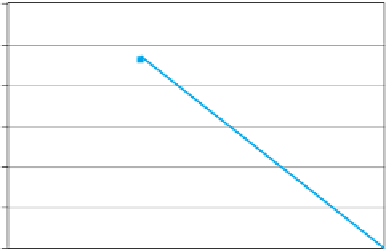
Figure 7.3. Relative sediment
deposition at the end of the
simulation period for Case 1 as a
function of the relative discharge
(according to Brownlie).
0.00
1.00
0.60
0.65
0.70
0.75
0.80
0.85
0.90
0.95
Relative discharge
In Case 1, the incoming sediment concentration (100 ppm) remains
constant for all the Rds and for the whole simulation period, but the total
volume of sediment entering the system decreases for smaller Rds. Smaller
discharges give smaller velocities that may result in more deposition of
the sediment. Due to the fact that the total volume of incoming sediment
during the simulation period depends on the relative discharge (Rd), a
relative deposition will be introduced to compare the sediment deposi-
tions for various Rds. This relative deposition is the ratio of the sediment
deposited in the entire canal and the total incoming sediment load at the
head, both during the simulation period of 90 days:
total deposition in canal
total volume of incoming sediment load
Relative deposition
=
(7.2)
Case 1 has also been used to compare the three sediment predic-
tors that are included in the SETRIC programme, namely Ackers-White,
Brownlie and Engelund-Hansen. For the above mentioned design char-
acteristics the sediment deposition in the canal has been evaluated for
the three predictors. The equilibrium concentration according to Ackers-
White and Engelund-Hansen for the design discharge is lower than for
Brownlie, which means that sediment deposition will already occur for
these predictors at the design discharge. For smaller discharges the total
volume of deposition will increase for both predictors in the same way as
for the Brownlie predictor (Figure 7.3), but the total amount of sediment
deposited will be larger (see Table 7.2).


Search WWH ::

Custom Search