Environmental Engineering Reference
In-Depth Information
8.2 THE USE OF INDICATORS
We are used to economic indicators, either at private level such as cash at the bank or at
national level such as GDP or market interest rates. Economic indicators are designed to
provide information on the state of the economy in a simple and clear manner. The use of
indicators, however, is not restricted to the economic sphere; they exist for all parts of the
environment. An indicator may be as simple as the concentration of a chemical element
in an environmental medium or a much more complex index that combines various data in
one number. The following introduces a number of site and company-level environmental
indicators designed to facilitate assessing the current state of the environment, and to moni-
tor future environmental change. It is not intended to provide a prescriptive listing of indi-
cators to be used in every circumstance. The diverse nature of the environment at any given
mine site, in particular in regard to biodiversity and social fabric, makes this an unrealistic
expectation.
Why Indicators?
Environmental indicators are a way of presenting complex information in a simple and
clear manner (
Case 8.1
). It is impractical if not impossible to measure all environmental
parameters, such as for example the concentration in water of all elements in the periodic
table. Accordingly, the practice that has developed is to select environmental indicators
that will represent the situation. These are physical, chemical, biological, or socio-economic
measures that best represent the key elements of a complex ecosystem or environmental
issue. An indicator's dei ning characteristic is that it quantii es and simplii es information
in a manner that facilitates understanding of environmental issues by both decision-mak-
ers and the public. Indicators are superior data as an analytical tool, since they commonly
present several data in one number.
An indicator is not only important for establishing the environmental baseline but is
embedded in a well-developed interpretive framework that has meaning beyond the
Environmental indicators are
a way of presenting complex
information in a simple and clear
manner.
GINI COEFFICIENT
100%
CASE 8.1
The Gini Coeffi cient as a Measure of
Inequality of a Distribution
GINI INDEX
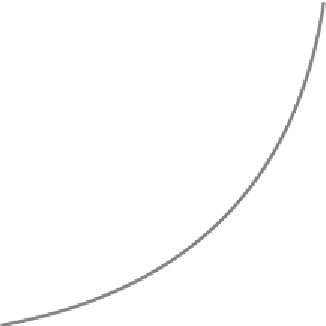
The Gini coeffi cient is a measure of inequality of a
distribution, defi ned as the ratio of area between the
Lorenz curve of the distribution and the curve of
the uniform distribution, to the area under the uniform
distribution. It is often used to measure income inequality.
It is a number between 0 and 1, where 0 corresponds to
perfect equality (i.e. everyone has the same income) and 1
corresponds to perfect inequality (e.g. one person has all
the income, while everyone else has zero income).
It was developed by the Italian statistician
Corrado Gini and published in his 1912 paper
'Variabilità e mutabilità' ('Variability and
Mutability'). The Gini coeffi cient is equal to half of
the relative mean difference. The Gini index is the
Gini coeffi cient expressed as a percentage, and is
equal to the Gini coeffi cient multiplied by 100.
0
0
100%
The Cumulative Share of People from
Lower Income


Search WWH ::

Custom Search