Environmental Engineering Reference
In-Depth Information
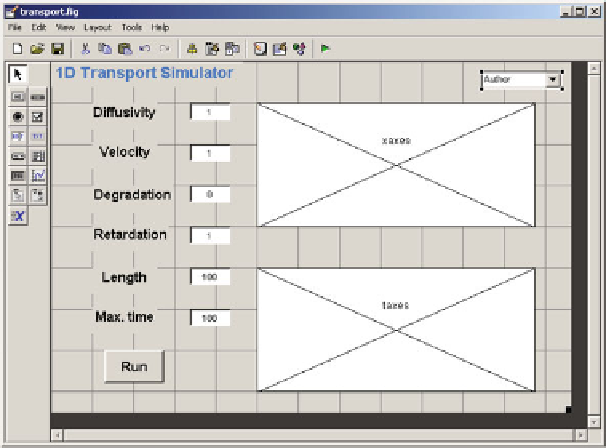
Fig. 20.7 The extended example GUI, in production using MATLAB
guide
®
axes gets the tag 'taxes' (for time axis). As header we introduce another static text
element, for which font size, font weight and color are changed from default. As third
adjustment we enter a pop-up menu. Using again the property inspector we specify
'Author', 'Book', 'Publisher' and 'Software' as four entries in the 'String' property.
After these adjustments of the last sub-chapter GUI, use 'Save' in the
MATLAB
guide menu to store the new figure. Note that the
'transport.m'
is
also changed as a result of the 'Save' click. The interested user may have a look into
the M-file listing to see some new 'callback' and 'create' command blocks,
corresponding with the new elements.
As a next step, the new M-file has to be extended to include a new functionality.
Within the command block, related to the run-button, the following list should be
added at the end, i.e. behind the commands concerning the space plot:
®
% Create time plot
x = linspace (L/10,L,10);
axes(handles.taxes);
t = linspace (T/100,T,100);
h = 1./(2.*sqrt(D*R*t));
for
i = 1:size(x,2)
hh = plot(t,c0*exp(-lambda*t).*(e-0.5*erfc(h.*(e*R*x(i)...
-v*t)))-0.5*exp((v/D)*x(i))*erfc(h.*(e*R*x(i)+v*t))+...
(cin-c0)*0.5*(exp((v-u)/(D+D)*x(i))*erfc(h.*(e*R*x(i)...
-u*t))+exp((v+u)/(D+D)*x(i))*erfc(h.*(e*R*x(i)+u*t)))...
,y(mod(i,7)+1));
set (hh,'LineWidth',2)
hold on;
end
grid on
hold off