Environmental Engineering Reference
In-Depth Information
200
5.8
150
5.6
100
5.4
50
5.2
5
0
4.8
-50
4.6
-100
4.4
-150
4.2
4
-200
0
50
100
150
200
250
300
350
400
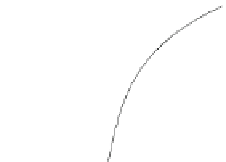
Fig. 15.5 Bank filtration example plot (for
a
x
¼
100 m,
A
x
¼
-10
6
m
2
/s,
Q ¼
0.001164 m
3
/s)
4
3
2
1
0
-1
-2
-3
-4
-5
-5
-4
-3
-2
-1
0
1
2
3
4
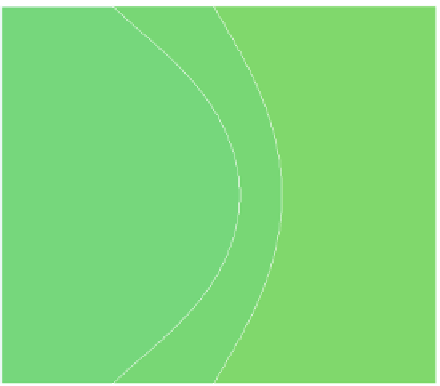
Fig. 15.6 Image of vortex; filled contours for potential and white contour lines for streamfunction
Those, who do not believe that the procedure works, may evaluate formula (
15.9
)to
obtain the same result.
Figure
15.6
shows a vortex with circulating flow as another flow pattern which
can be modelled by using the analytical method. The detailed steps of the method
are summarized in Sidebar 15.1.