Environmental Engineering Reference
In-Depth Information
0.9
given
modelled
0.8
0.7
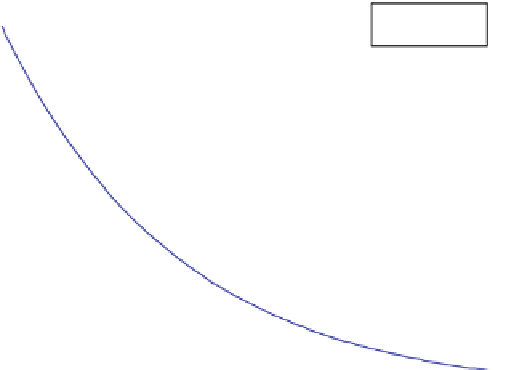
λ
:0.35537
c
0
:0.83319
0.6
0.5
norm of residuals: 0.057169
0.4
0.3
0.2
0.1
0
0
1
2
3
4
5
6
7
8
Fig. 10.6 Exponential fit for l and
c
0
The result of the estimation procedure for both parameters is
l
¼
0.355 and
c
0
¼
0.833. Figure
10.6
depicts the result with the improved norm of residuals
equal to 0.057. For the chosen data set the change of parameters in the last two steps
is relatively marginal, but in general that can be very different. It can be crucial to
apply a procedure that really delivers optimal approximation.
Example 1
For many substances in many environmental compartments it can be assumed that
sorption processes are fast in comparison to degradation processes. If this is true,
the first drop of the concentration from the original concentration
cref
in solution
(in the example 1
m
g/l) to a value of
c0
can be attributed to sorption: part of the total
mass available attaches to the surfaces of the porous material. The slow decline
observed thereafter is due to degradation processes. Concerning degradation we
assume a linear degradation characteristic (compare Chap. 5). The temporal devel-
opment of the system can be described by the differential equation:
@c
@t
¼
l
c
(10.14)
Note that the retardation factor disappears, as
R
is a coefficient in both relevant
terms in the equation. The solution of the differential equation is
cðtÞ¼c
0
exp
ð
l
tÞ
(10.15)