Environmental Engineering Reference
In-Depth Information
1
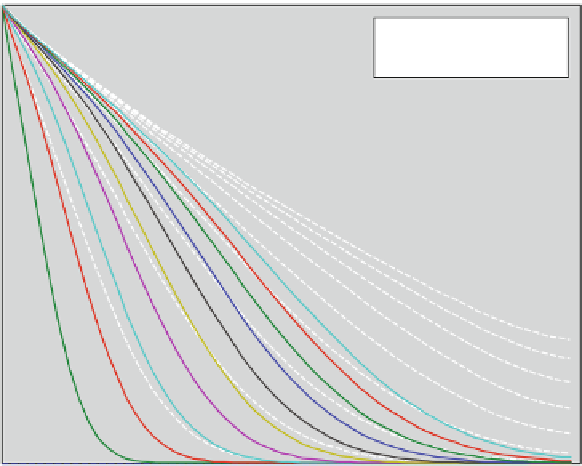
concentration
white broken: tracer
colour: retardation 2
0.9
0.8
0.7
0.6
0.5
0.4
0.3
0.2
0.1
0
0
0.2
0.4
0.6
0.8
1
space
Fig. 6.4
Result of exercise 6.2; both situations are represented by ten concentration curves, which
represent the proceeding front. Dotted lines without markers represent the case without retarda-
tion; lines with markers represent the front for a sorbing species with the same degradation rate
R
appears as the coefficient
c
of the time derivative and in the assignment for
s
.
With this version of
'pdepetrans.m'
all applications, which were presented above
using the
'analtrans.m'
or
'simpletrans.m'
files, can be run. Recall that the advan-
tage of
'analtrans.m'
is that there are no numerical errors as an analytical solution is
evaluated explicitly. The advantage of the
'simpletrans.m'
algorithm is that it can
be implemented outside of MATLAB
or any other mathematical software pack-
age. The advantage of
'pdepetrans.m'
is that it can be easily extended to include
other processes which cannot be taken into account by the other methods. This is
demonstrated in the following for problems of extended complexity for fast and
slow sorption.
First it is shown how the code can be extended to include all types of fast
sorption, i.e. linear sorption using formula (
6.2
), Freundlich sorption using formula
(
6.18
) or Langmuir sorption using formula (
6.19
). In the extended version of the M-
file, the retardation factor is calculated from two sorption parameters, depending on
the
sorption
option chosen in the initialization part of the M-file. The new lines
in the input part are as follows:
®