Environmental Engineering Reference
In-Depth Information
which is obtained for
Pe ¼
0, i.e. for no advection. The graphs of functions (
5.22
)
for different values of the second Damk
€
ohler number are presented in Fig.
5.3
. The
following MATLAB
code is used for the plot. Markers in lines were added by
post-processing with the MATLAB
®
®
figure-editor.
The corresponding M-file
'analtrans_s1'
is included in the accompanying
software.
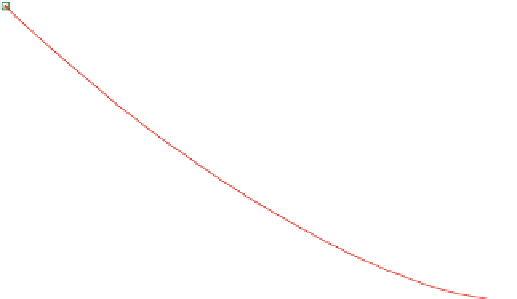
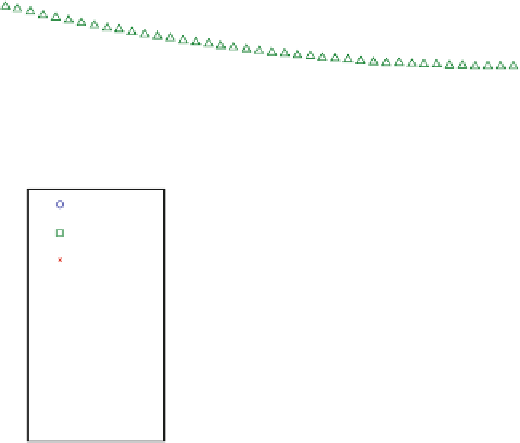
The result of a varying P´clet number is illustrated in Fig.
5.4
. All but one of the
depicted curves are calculated for
Da
1
¼
1 and variable
Pe
. The unit value of
Da
1
guarantees equal importance of advection and degradation or decay. The increasing
1
0.9
0.8
0.7
Pe = Inf
Pe=10
Pe=5
Pe=4
Pe=3
Pe=2
Pe=1
Pe = 0.5
Pe = 0.25
0.6
0.5
0.4
0
0.2
0.4
0.6
0.8
1
x/L [-]
Fig. 5.4
Profiles for fluid phase concentration in case of transport with constant parameters for
Da
1
¼
1 in dependence of the P´clet number
Pe