Environmental Engineering Reference
In-Depth Information
the main file. A general term for such a numerical procedure is
operator splitting
.
The
for
-loop mimics advancing time. A snapshot of the output of the m-file looks as
follows (Fig.
4.6
):
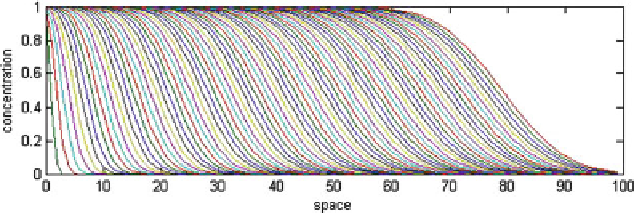
The graph was obtained by ending the loop in the main module at a value lower
than
N
. In the graph the build-up of a transition zone with concentrations between
initial concentration and inflow concentration is obvious (which here is not the result
of a graphic routine on discrete data). The transition zone moves with the advancing
front, in the figure from left to right. It is also obvious that the transition zone widens
with time. In other words: the gradients of the concentration curves become less steep.
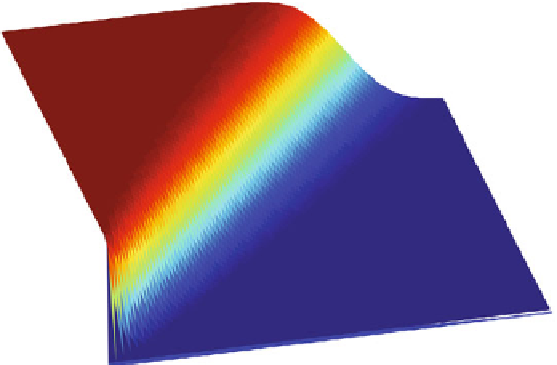
That is even better visible in the (
x,t
)-diagram, produced with the
surf-
command:
As depicted in Fig.
4.7
, the concentration is shown as a surface above the
(x,t)
-
plane.
Fig. 4.6 Transport due to advection and dispersion; snapshot
from an animation using
'simpletrans.m'
c
1
0.5
80
0
60
t
40
20
100
80
60
40
0
20
x
0
Fig. 4.7 The solution of 1D transport in the space (x) - time (t) diagram, visualized as surface plot